
What changed, and where?
Trends sets sales beside worked hours, order channels, discounts and delivery times, for all stores or one. Each view puts the latest fully reported period next to an earlier one you pick, and most of them next to the same period last year.
How you work through it.
Are labor hours moving with sales?
Sales, orders and worked hours per day for the latest fully reported period beside an earlier one you pick, up to eleven periods back, with labor as a percent of sales and orders per worked hour. One sentence states the comparison, and a mark shows where sales and hours moved apart.
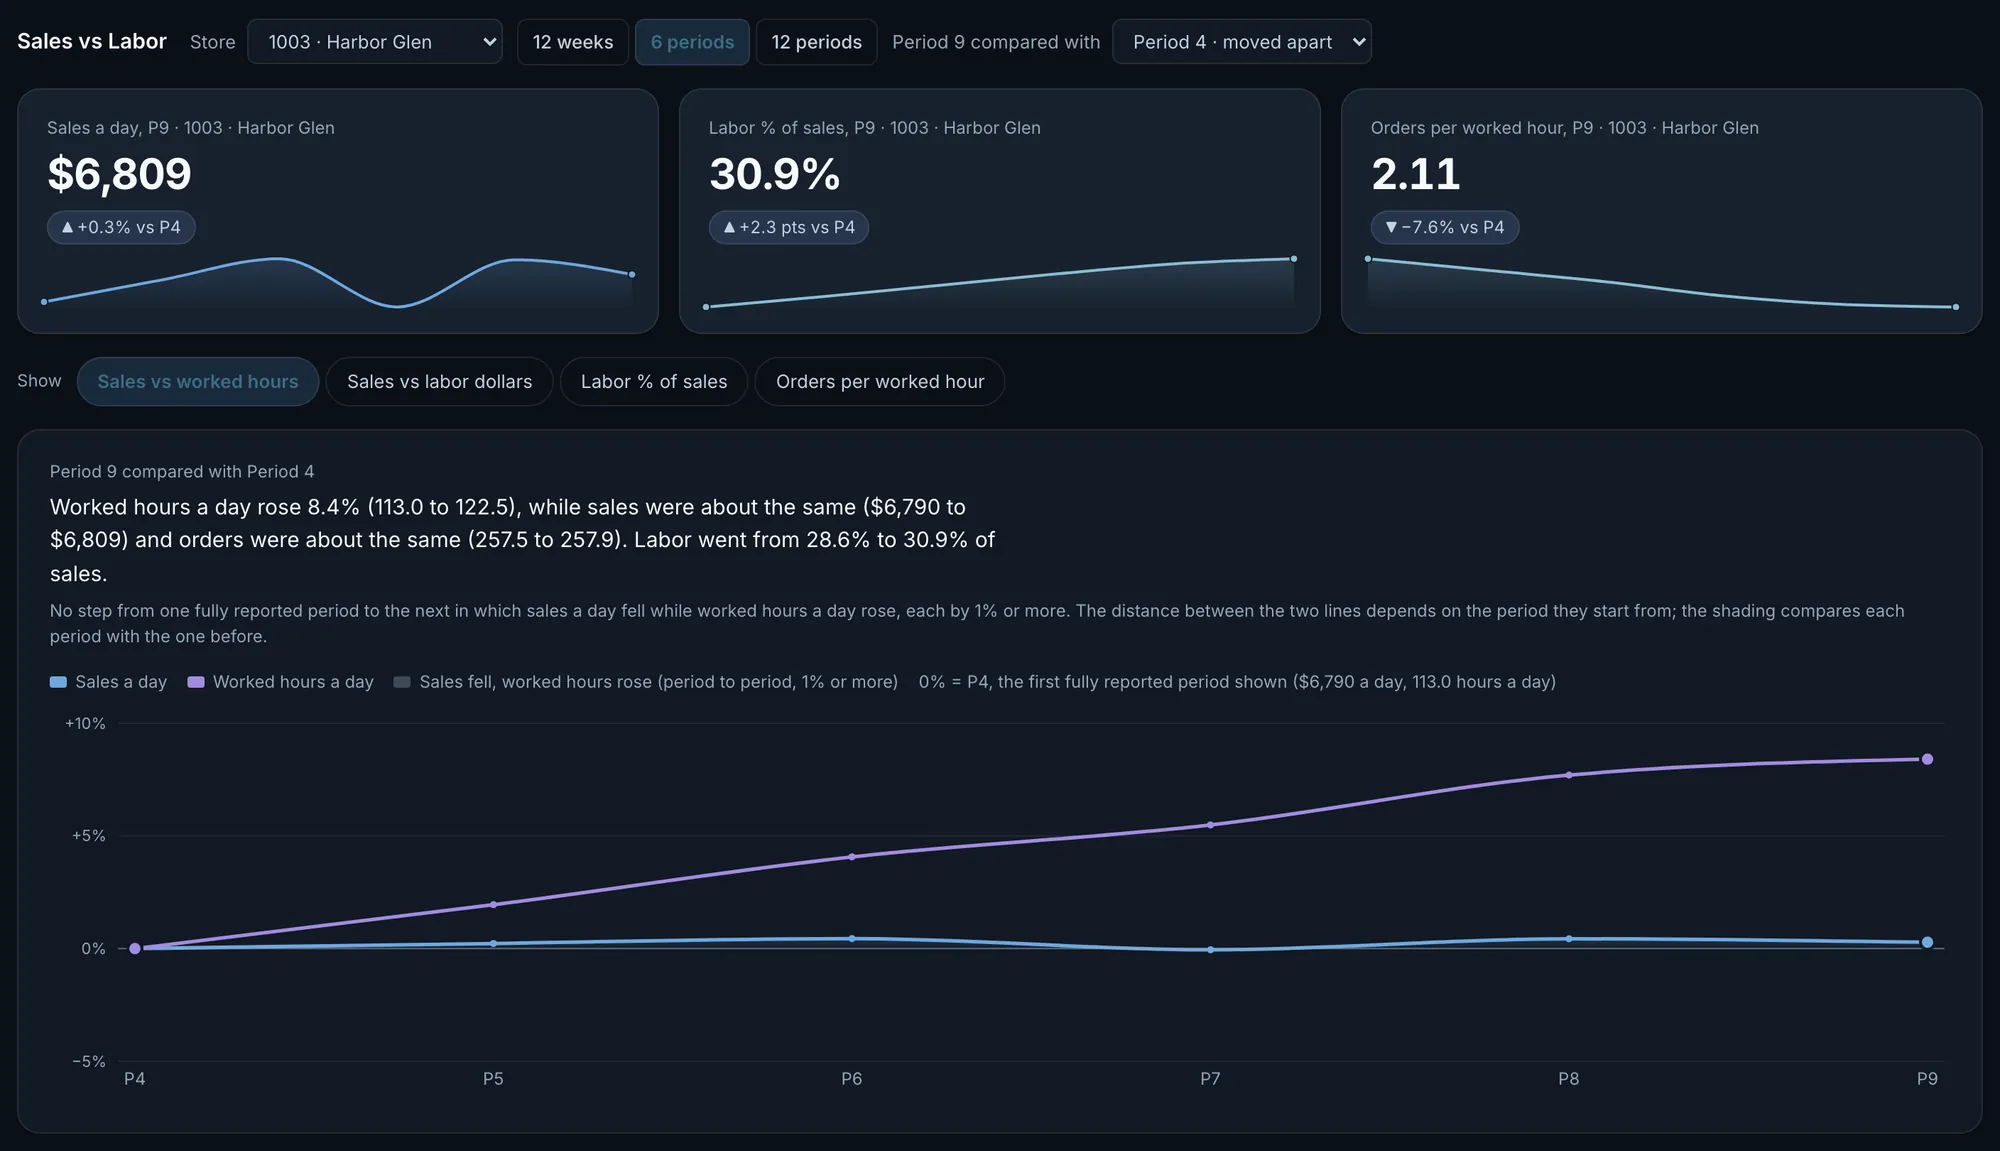
Harbor Glen, period 9 against period 4: worked hours a day rose 8.4% while sales a day were about the same. Labor, as Trends measures it, went from 28.6% to 30.9% of sales.Actual OpsIntel screen · synthetic demo data · tap to open full size How does each channel compare with last year?
Direct orders, DoorDash and Uber Eats side by side, with Grubhub and other marketplaces in the detail: sales, orders, share of sales and average order, against the same period last year when both are fully reported. Every change is per day, so a five-week period and a four-week period compare fairly.
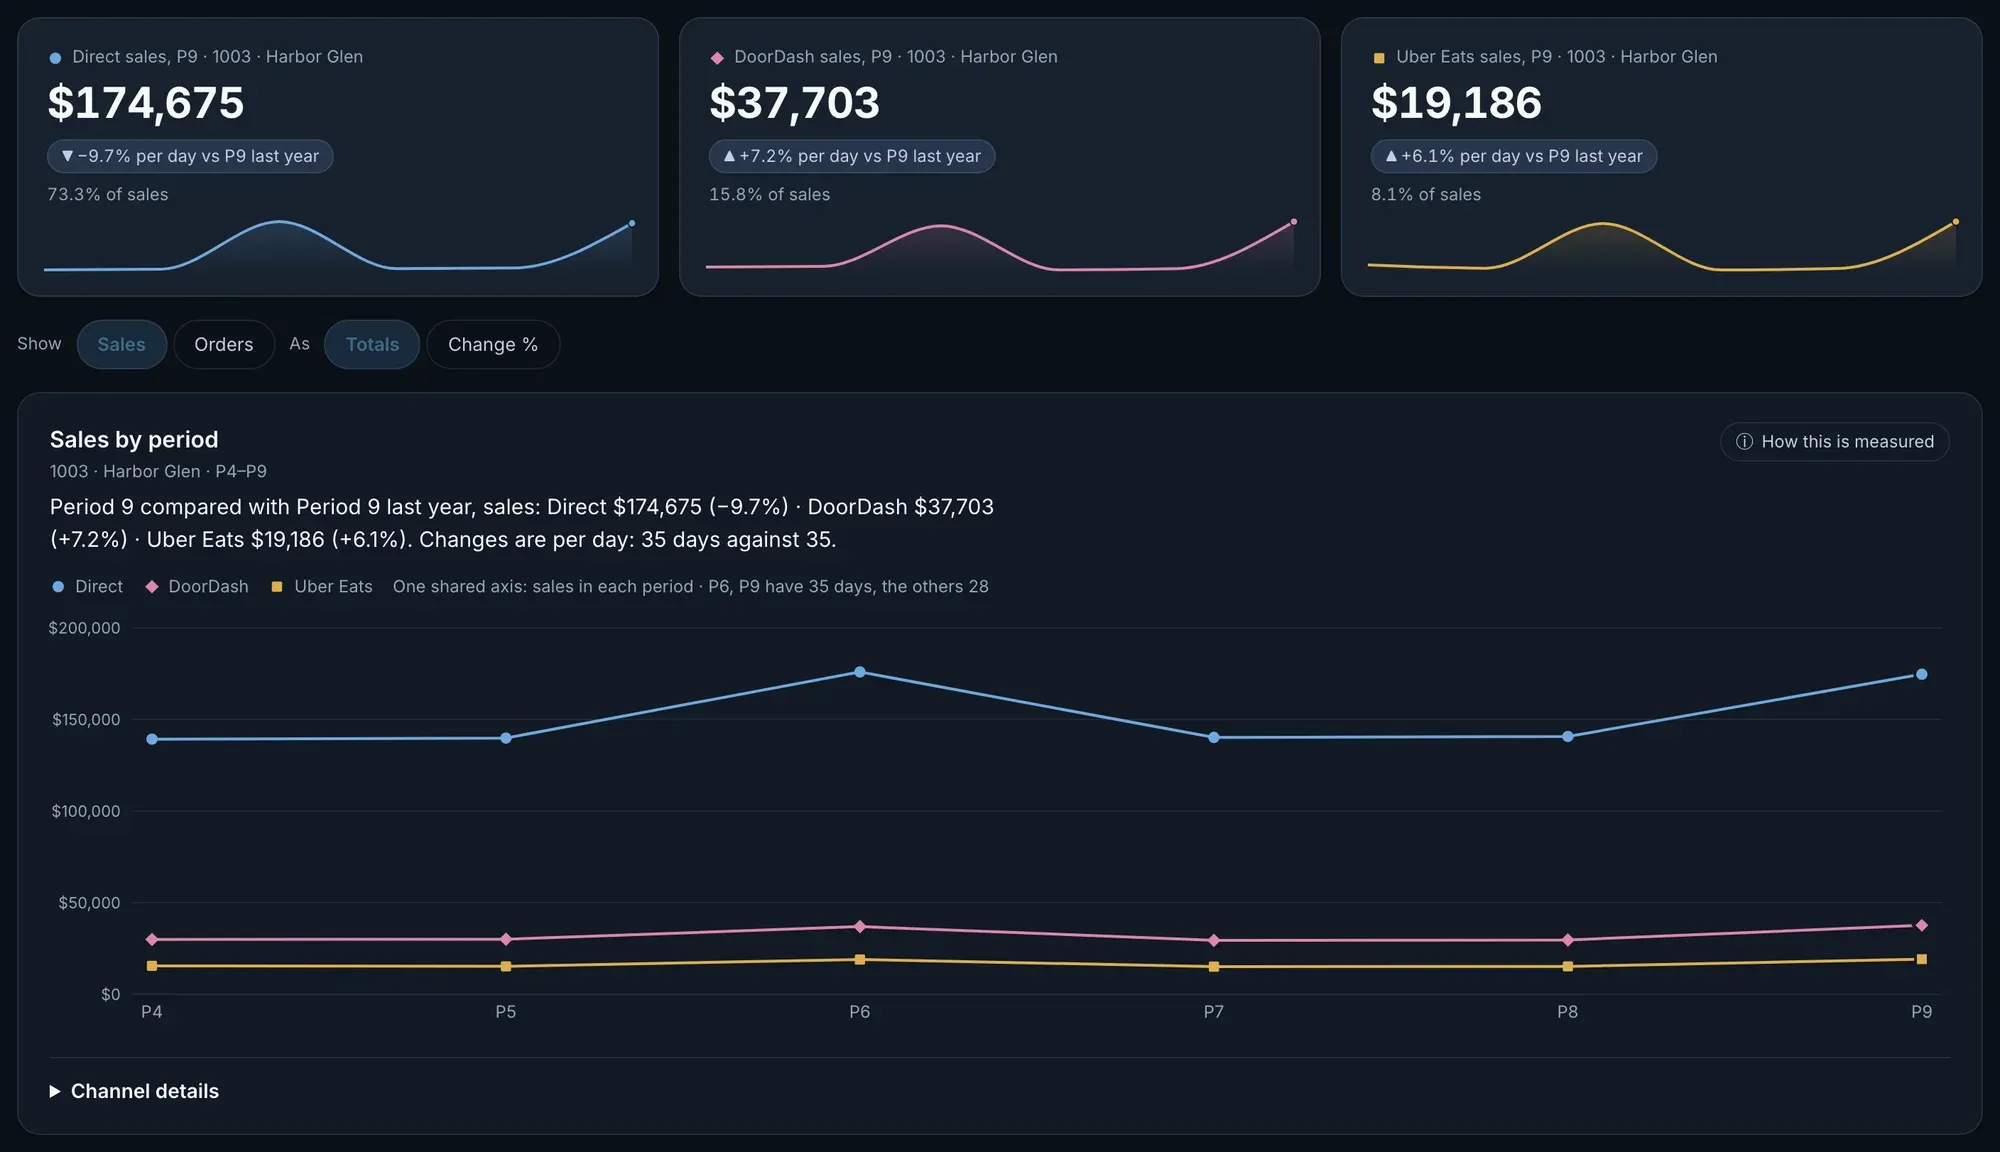
Harbor Glen, period 9 against the same period last year: direct sales down 9.7% per day, DoorDash up 7.2%, Uber Eats up 6.1%.Actual OpsIntel screen · synthetic demo data · tap to open full size Which stores moved, channel by channel?
One card per store: its marketplace sales, its sales in all channels, and the change per day in direct and in marketplace sales against the same period last year.
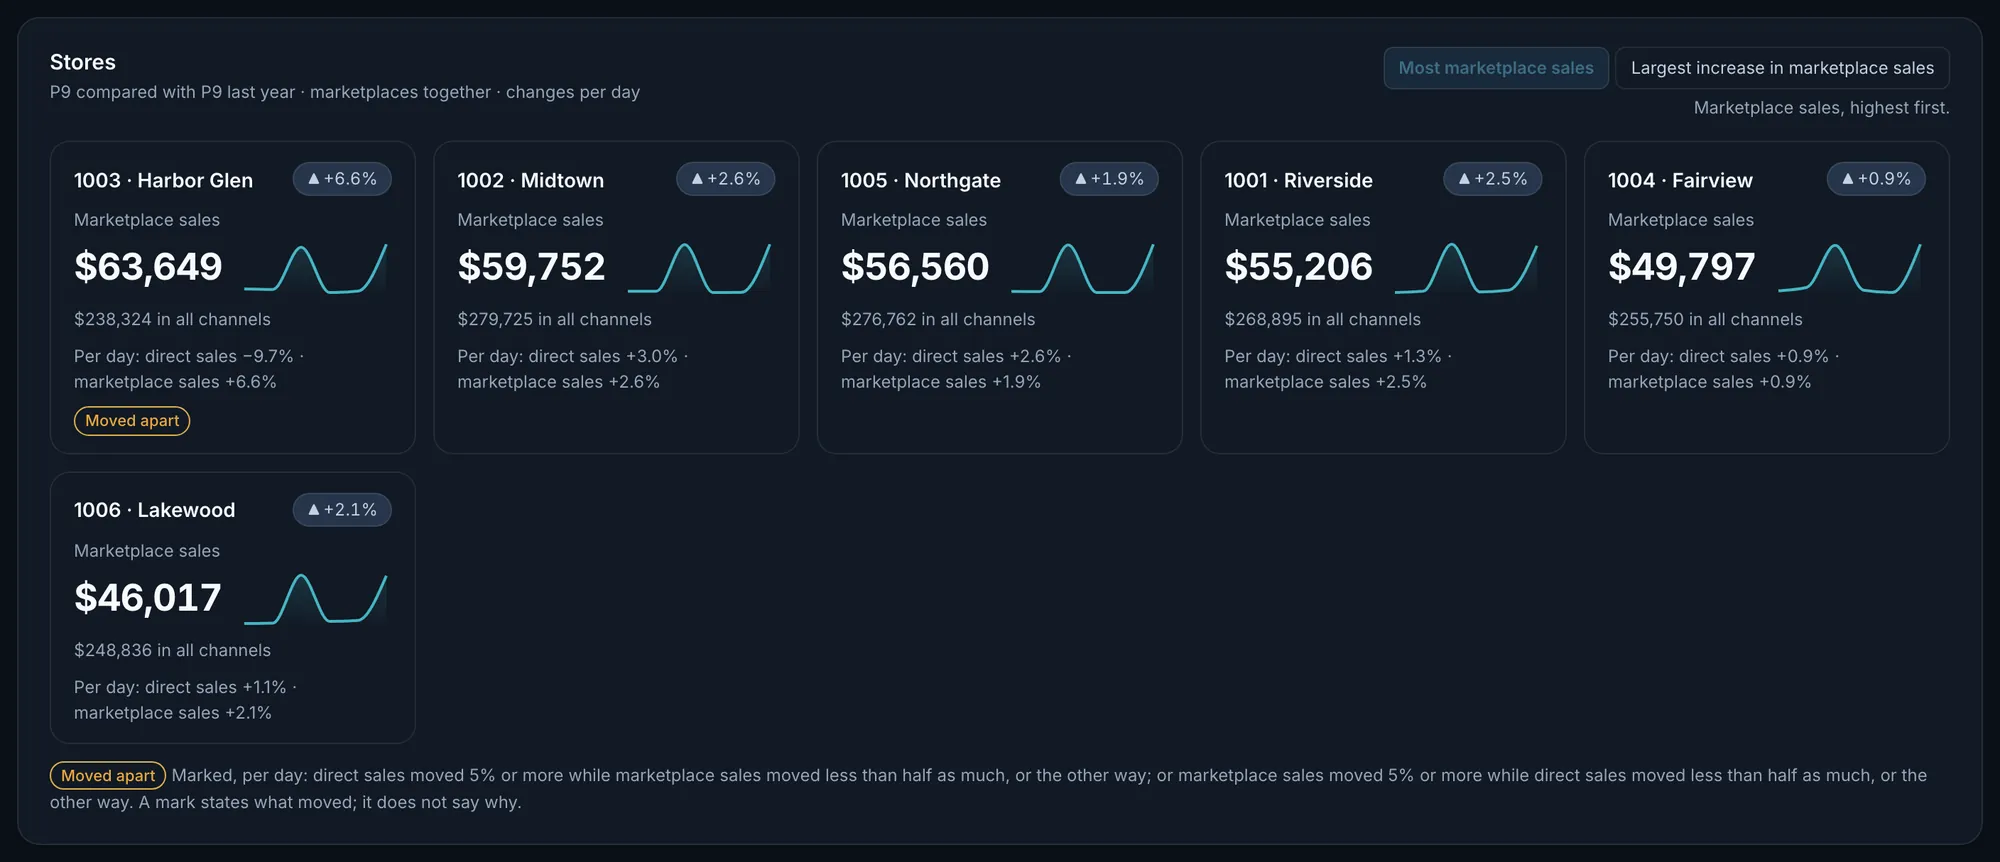
Actual OpsIntel screen · synthetic demo data · tap to open full size Which day of the week moved?
For one store or all of them together, a table of the seven weekdays: average sales, orders and worked hours on each, in the two periods you are comparing. With two or more stores, open a store in the channel view for its direct and marketplace sales by weekday against the same period last year.
Are deliveries leaving later, and on which days?
The share of timed deliveries that left the store 18 minutes or more after the order, always with the counts behind it, against the week or period before or the same weekdays 52 weeks earlier. A weekday is called out only when it has 100 or more timed deliveries and runs 10 points or more above the store’s other days. Orders and worked hours for the same weeks can be shown beside it.
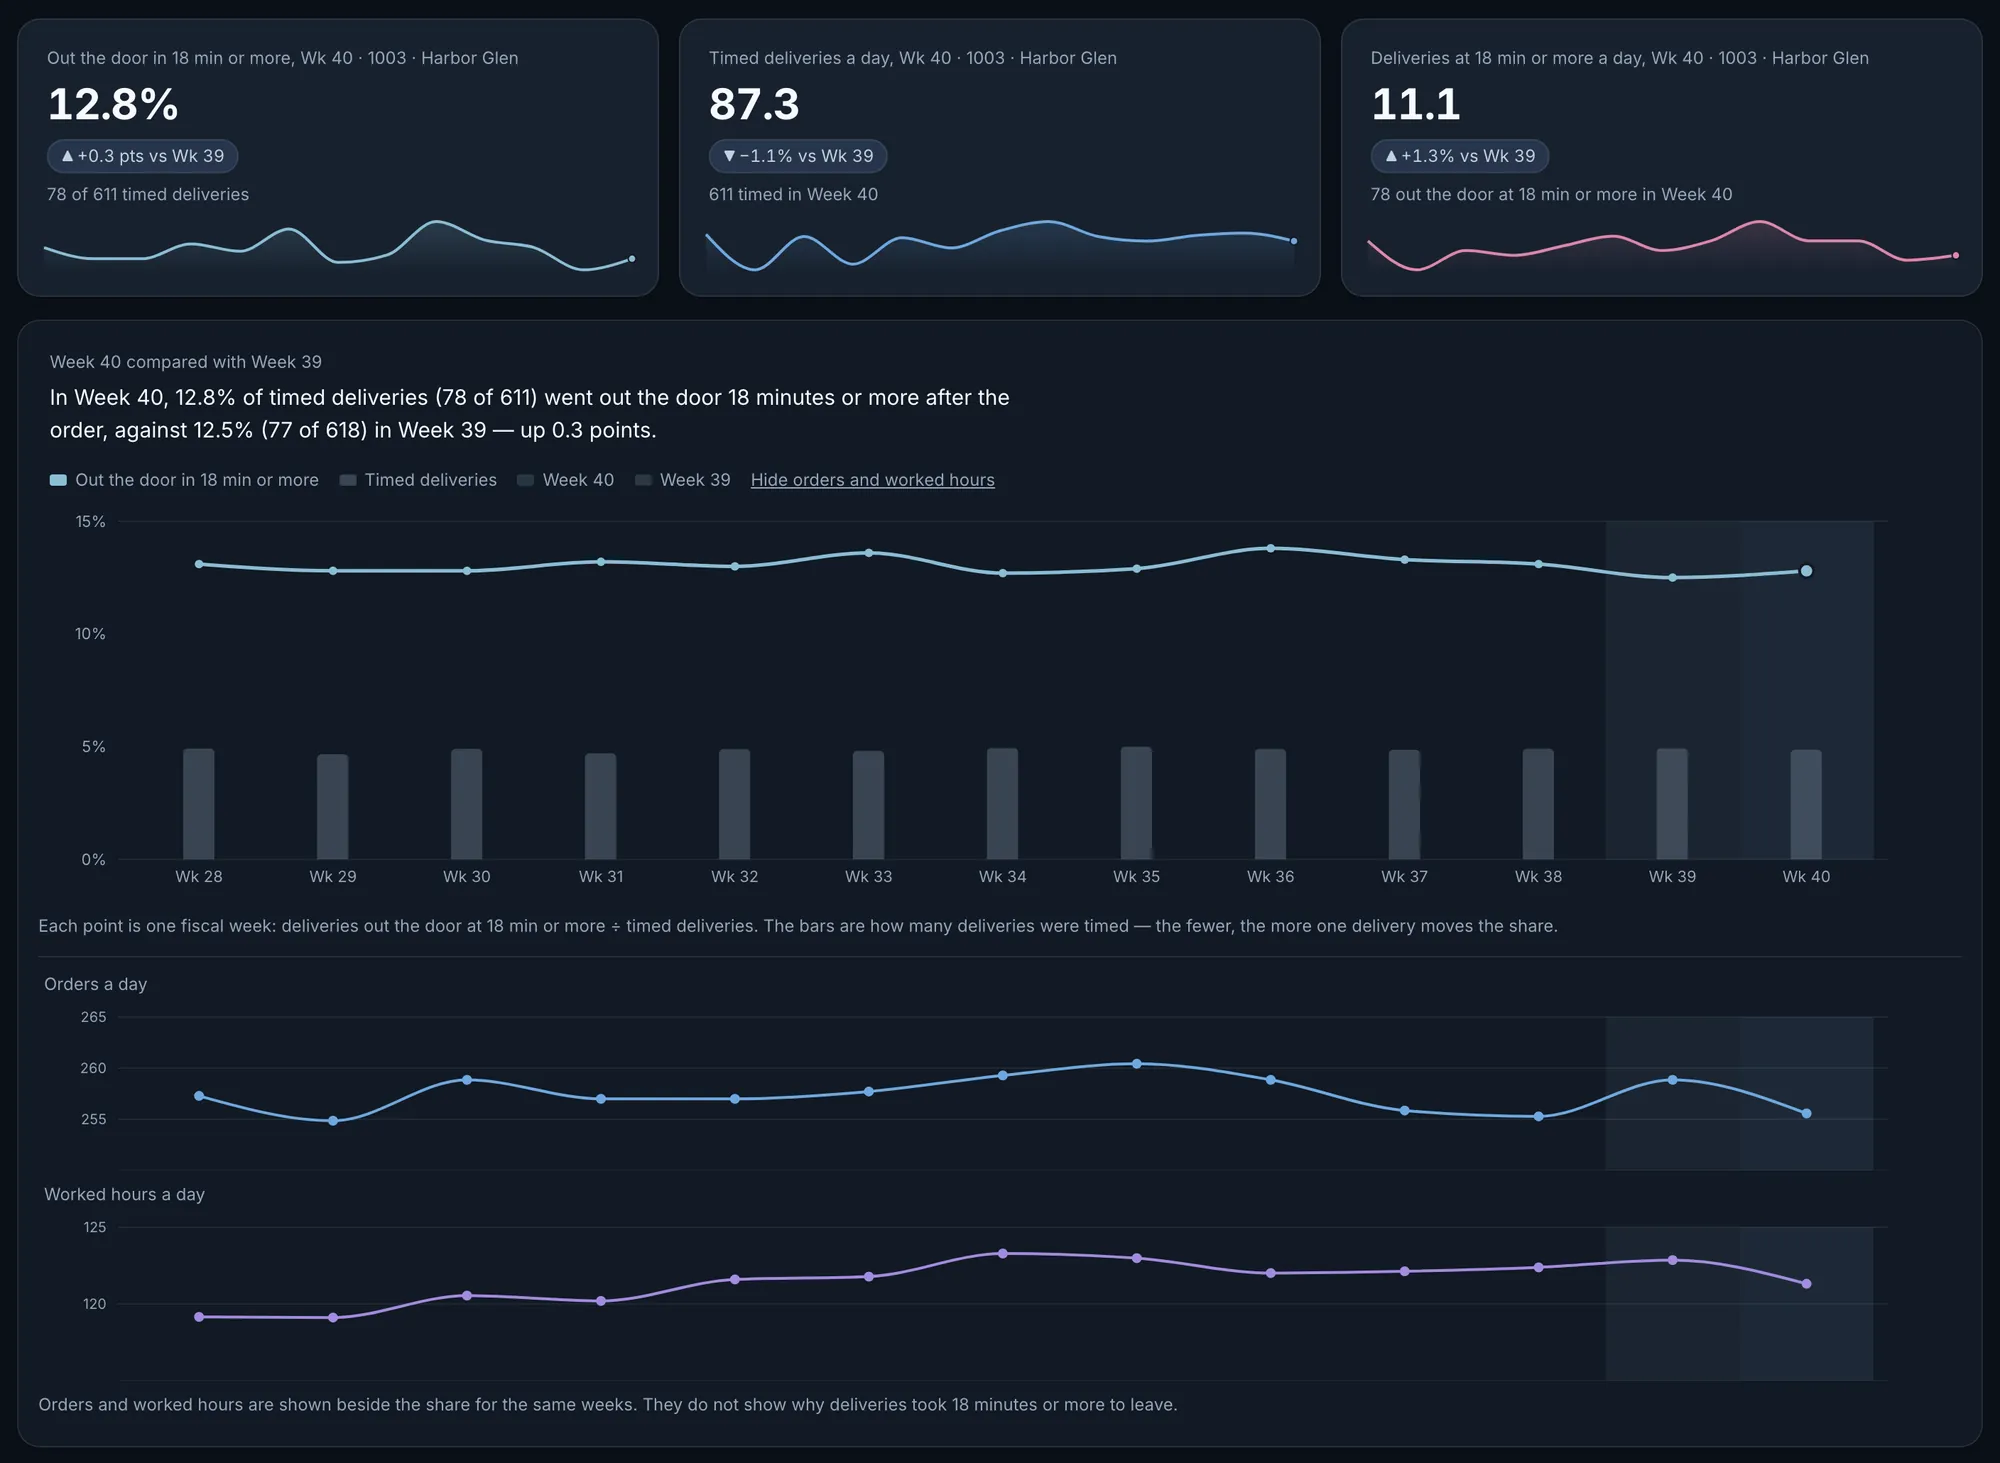
Harbor Glen, week 40: 12.8% of timed deliveries, 78 of 611, left at 18 minutes or more, against 12.5% the week before.Actual OpsIntel screen · synthetic demo data · tap to open full size See the weekday that stands out, with its counts.
Each day of the week shows its share, the deliveries behind it and the store’s other days beside it. The screen states its own rule for calling a day out, sets a 13-week pattern next to the period, and says in words that the figures show when deliveries took longer to leave, not why.
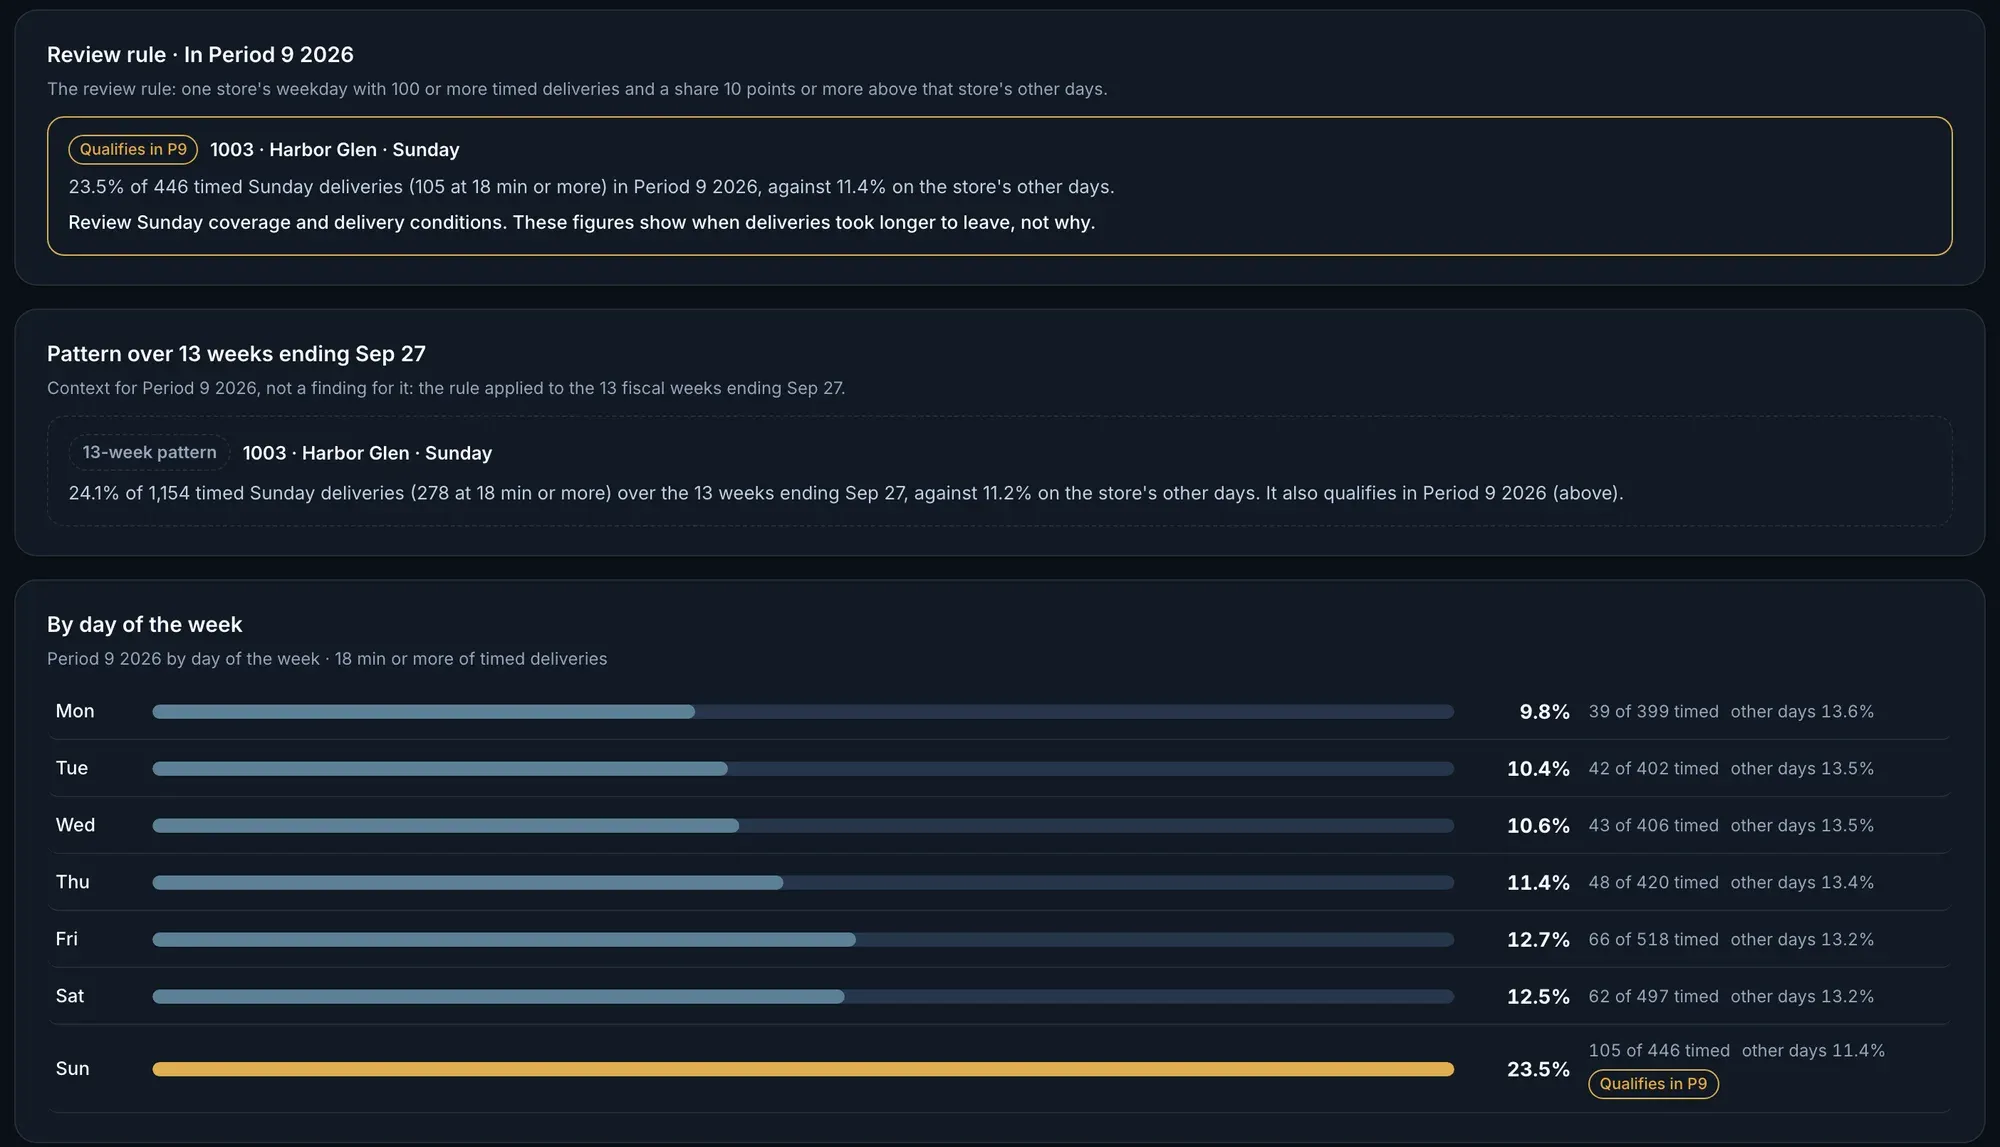
Harbor Glen, period 9: 23.5% of 446 timed Sunday deliveries left at 18 minutes or more, against 11.4% on its other days.Actual OpsIntel screen · synthetic demo data · tap to open full size Are discounts rising faster than sales?
Direct sales and discounts per day, the discount rate with the dollars behind it, and the discount per direct order, against an earlier period or the same period last year.
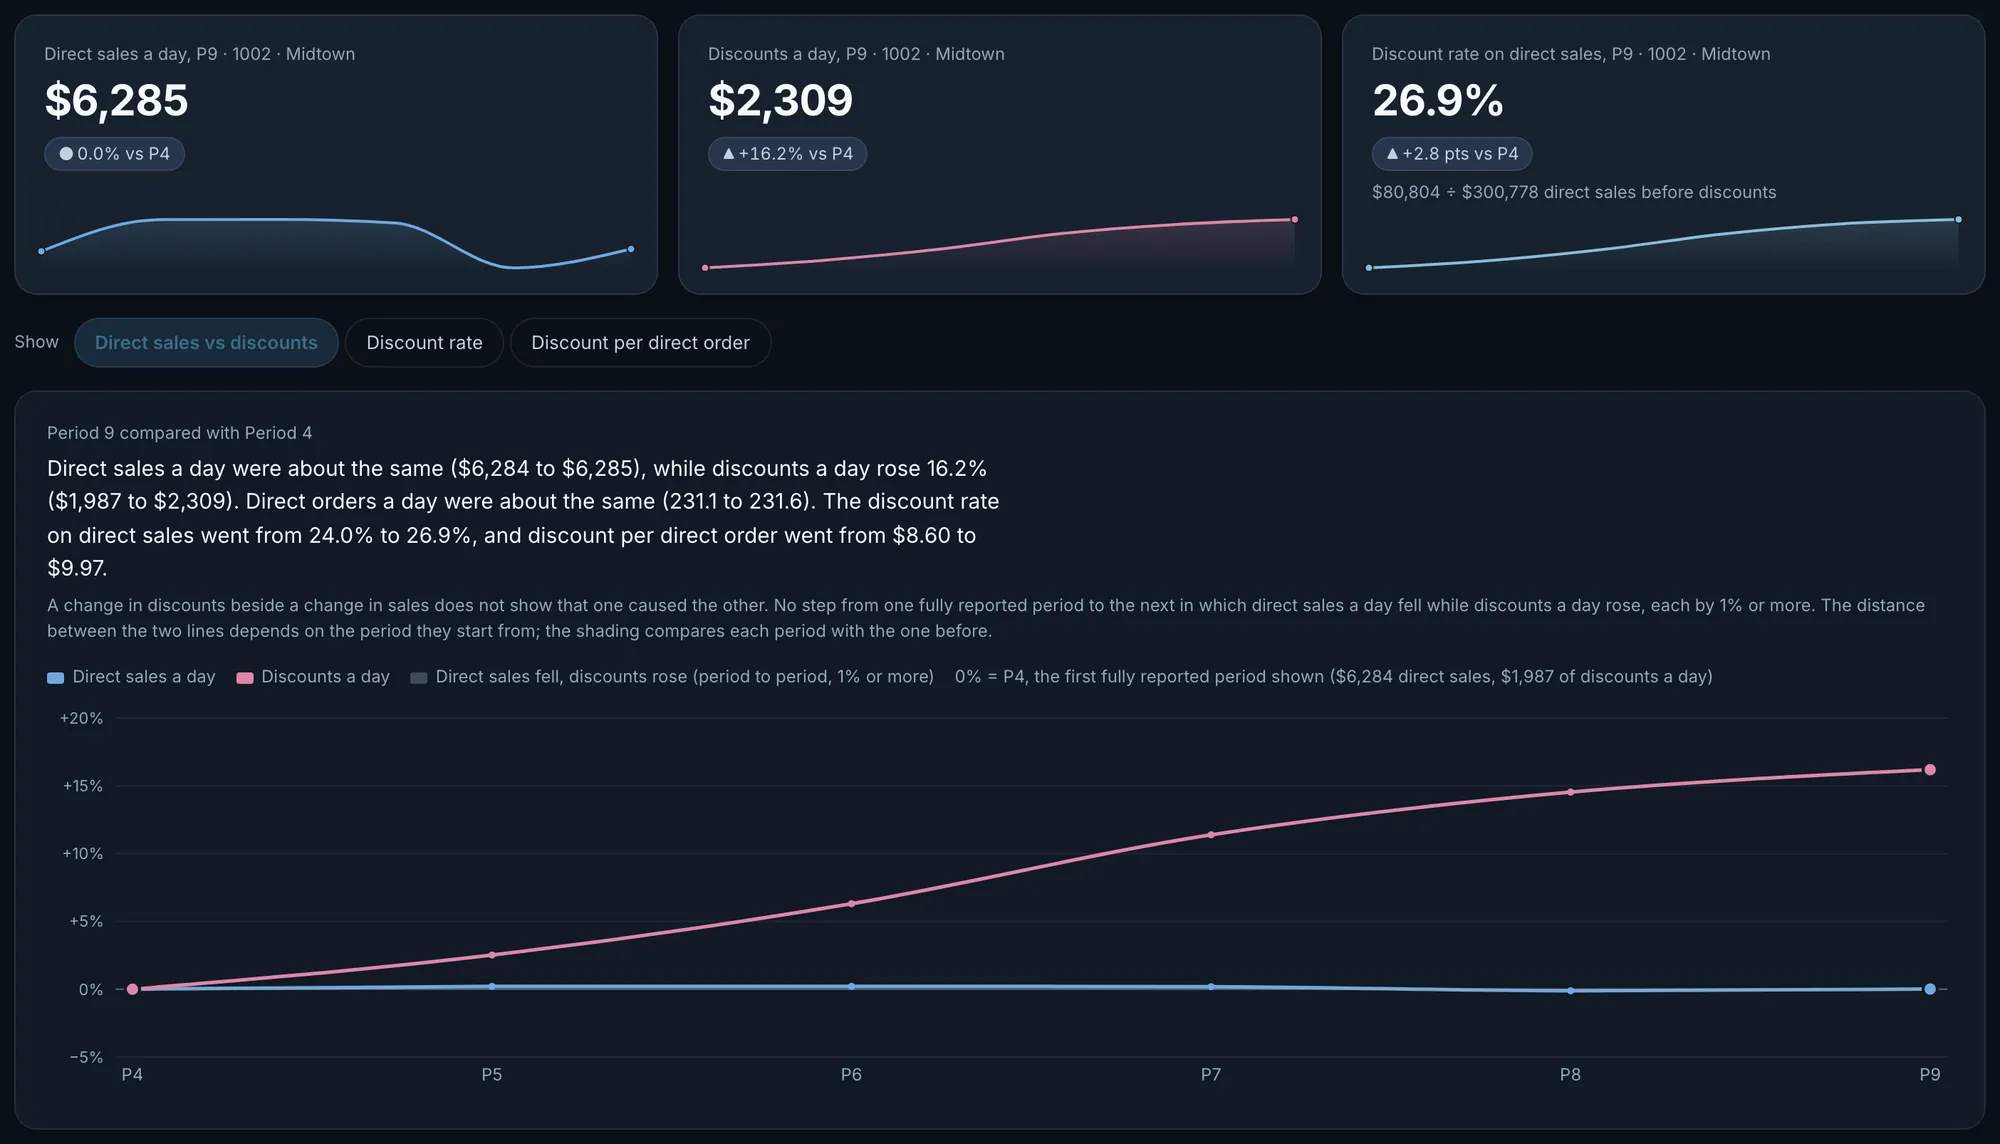
Midtown, period 9 against period 4: discounts a day rose 16.2% while direct sales a day were about the same. The discount rate on direct sales went from 24.0% to 26.9%.Actual OpsIntel screen · synthetic demo data · tap to open full size Which product lines moved?
Item sales by product line for a week or a period, beside the one before or the same weekdays 52 weeks earlier. Open a line for its product families, sizes, stores and dates. Each line’s change is split into the part that came with overall sales and the part that came from its share.
Worth knowing first.
- It shows which figures moved, where and by how much. It does not say why, and it prints that on the screen.
- Figures cover closed fiscal periods and completed weeks. A period with a store-day missing is shown but not compared.
- Channel sales are register sales, before marketplace fees, payouts or settlements.
- Labor here is wages for clocked hours as your franchise reporting system records them. It is not payroll cost.
- Delivery timing is the time an order takes to leave the store, for deliveries the store timed. Marketplace and plan-ahead orders are not timed.
- In the sales views, weeks are compared four at a time. Delivery timing and product lines compare a single week.
- Trends is part of the Premium plan.
See it on the live product.
A demo is thirty minutes.