Skip to content

Built by operators, for operators.

We do the analysis. You run the business.

OpsIntel brings every system your restaurants run on into one place, checks the numbers nobody has time to check, and alerts you when something goes wrong.
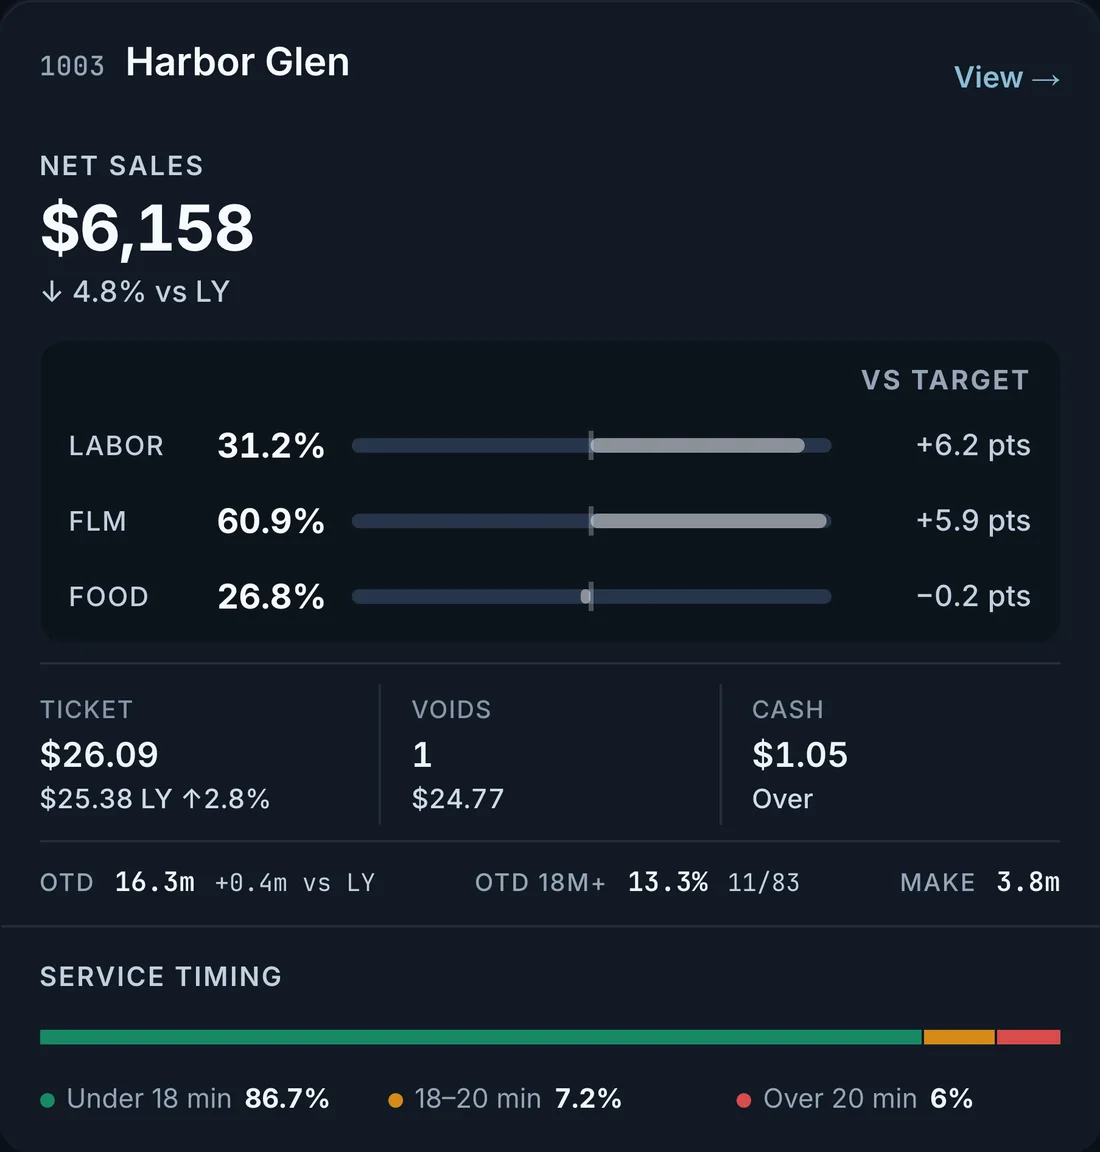

One store’s card on the Overview: net sales against last year, labor, FLM and food cost against target, ticket, voids and cash, out-the-door time, and the service timing bar.
Actual OpsIntel screen · synthetic demo data
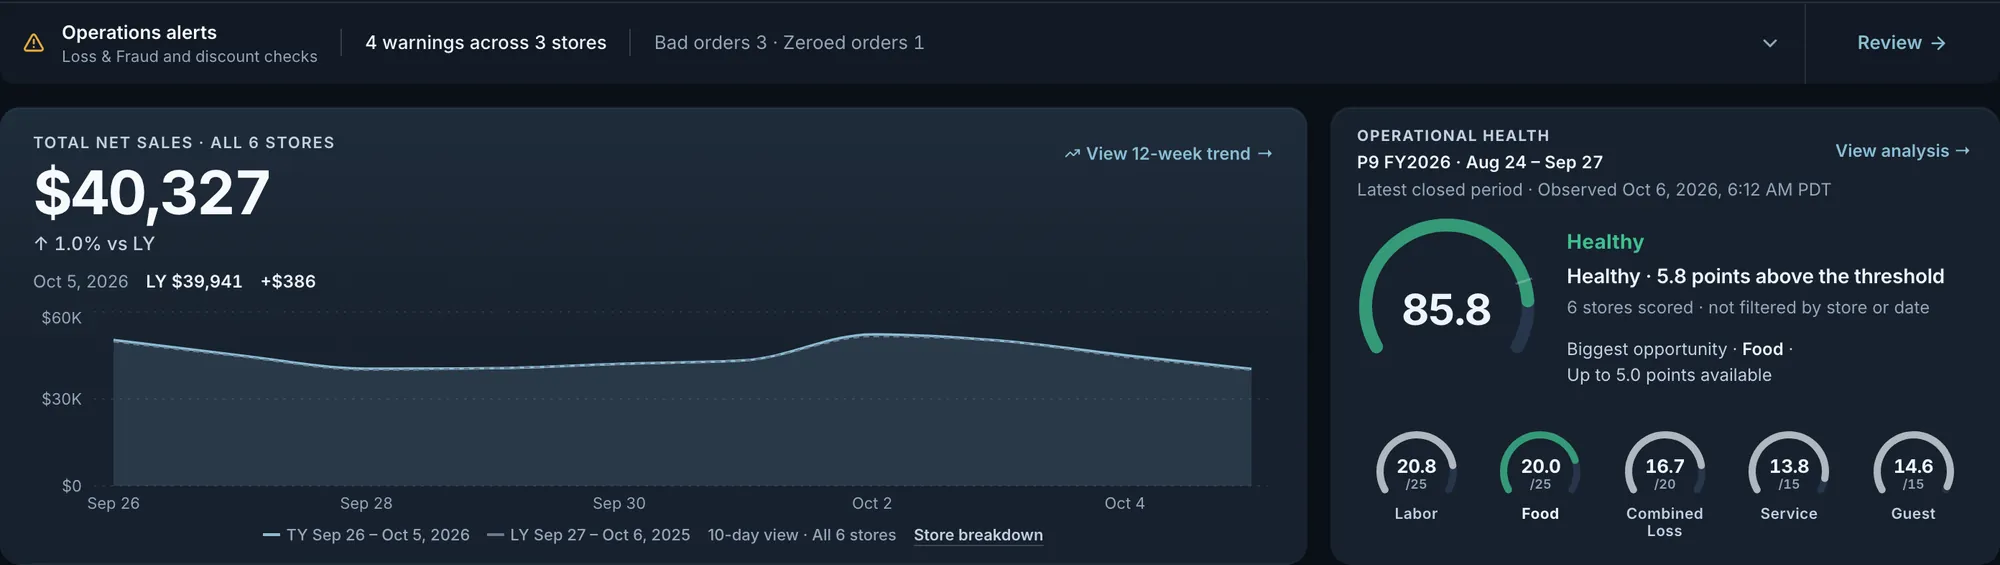
The Operations alerts row: 4 warnings across 3 stores, 3 for bad orders and 1 for zeroed orders.
Actual OpsIntel screen · synthetic demo data
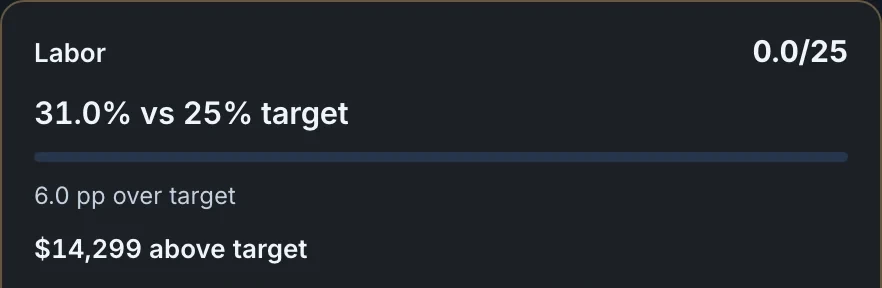
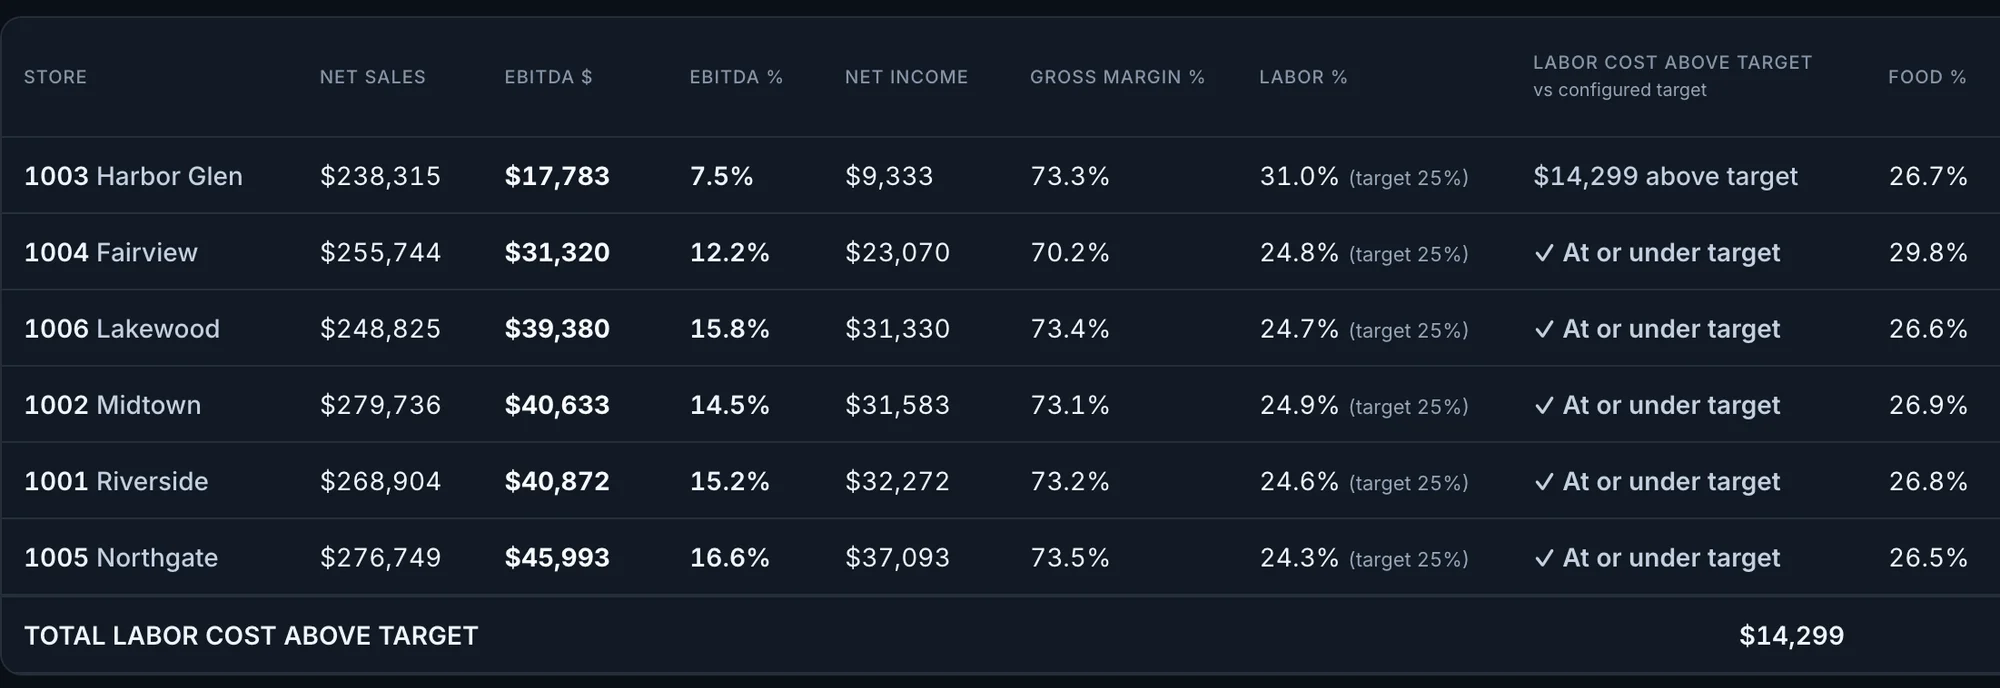
Harbor Glen’s labor for the last closed period: 31.0% against a 25% target, 6.0 points over, $14,299 above target.
Actual OpsIntel screen · synthetic demo data
One store on the real screens: Harbor Glen’s labor, 6.2 points over target on its card and $14,299 above target for the closed period.Actual OpsIntel screens · synthetic demo data

Your data. Our agents. Every day.

Every system your stores run on, in one place.

You stop opening each system for each store. Our system reads them all, every day, and sets each store beside last year and its own targets.

  • Point of saleSales, orders, voids and refunds
  • Time clock and schedulesEvery punch and every shift
  • InventoryCounts, orders and transfers
  • MarketplacesDoorDash and Uber Eats statements
  • AccountingXero and QuickBooks
  • Guest surveysScores by store and question

OpsIntel

  • Every store on one page
  • Checked against last year and your targets
  • An alert when something goes wrong

Every store, every day

What our system watches for you

The checks you would hand to an analyst, run on every store every day.

  • Loss and fraud

    Voided, cancelled, zeroed and refunded orders by store, and the losses that keep happening on the same shift.

    Loss and Refunds
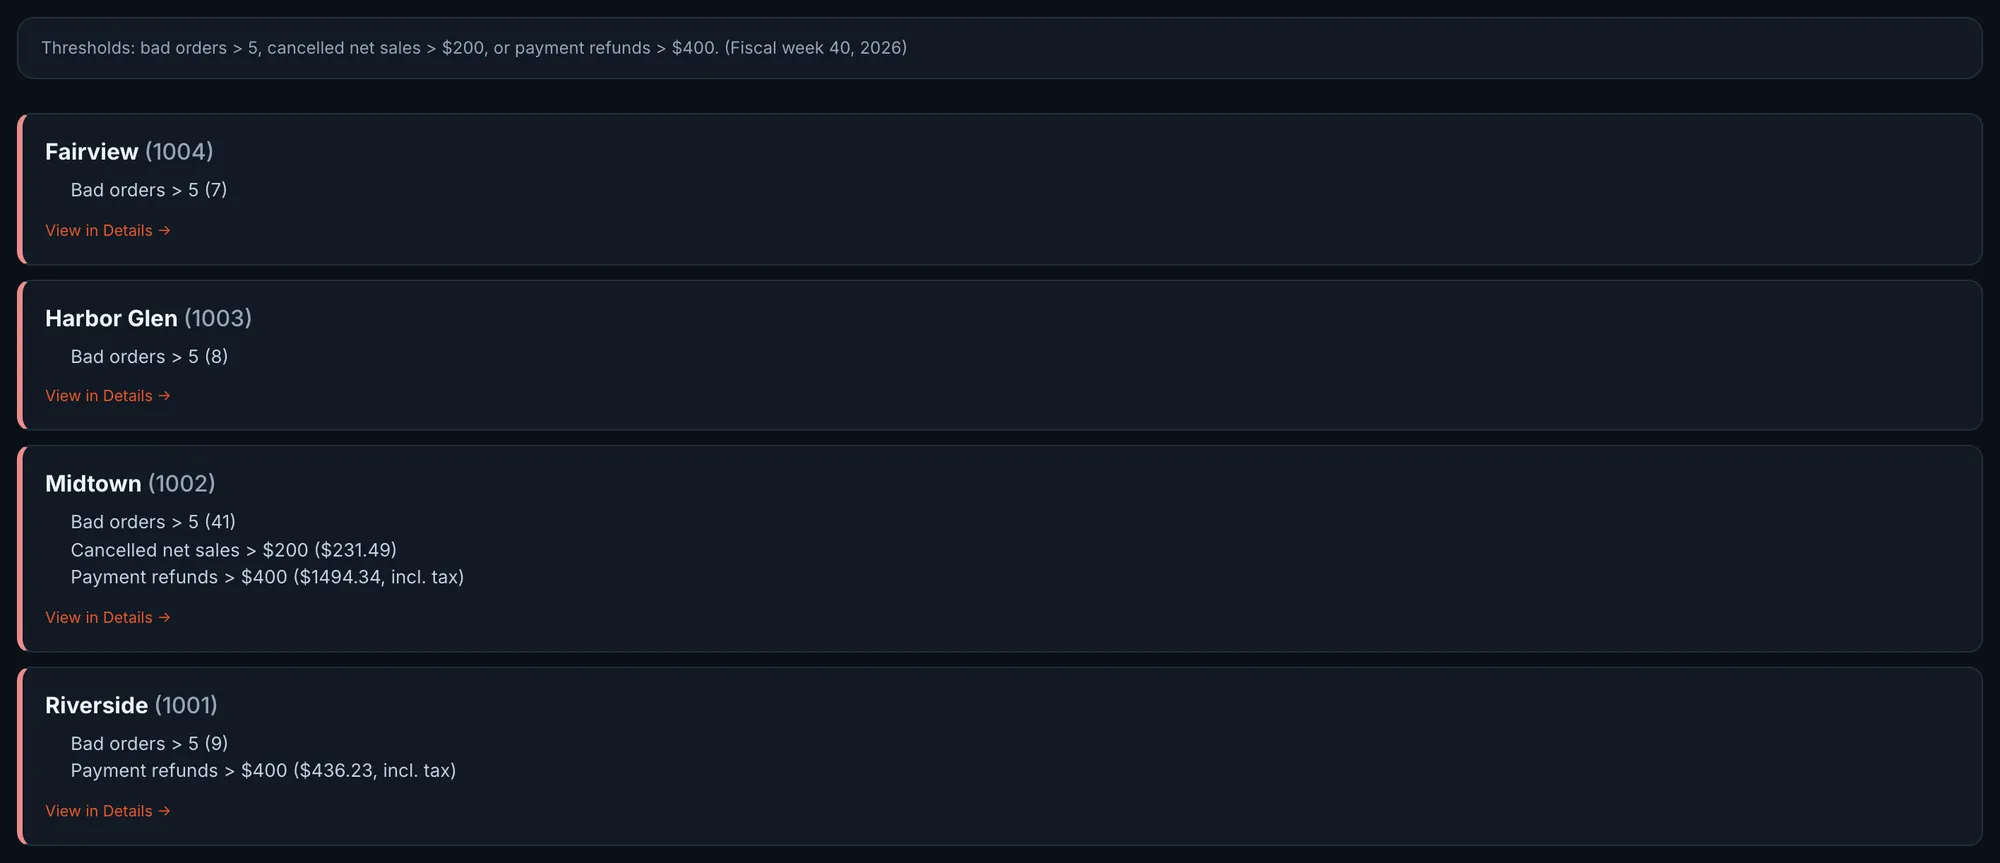
    The thresholds stated at the top, then four stores listed with the amounts they exceeded. Midtown exceeds all three. (opens the full-size screen)
    Midtown is over all three: 41 voided orders, $231.49 cancelled, $1,494.34 in payment refunds.Actual OpsIntel screen · synthetic demo data
  • Labor and time clocks

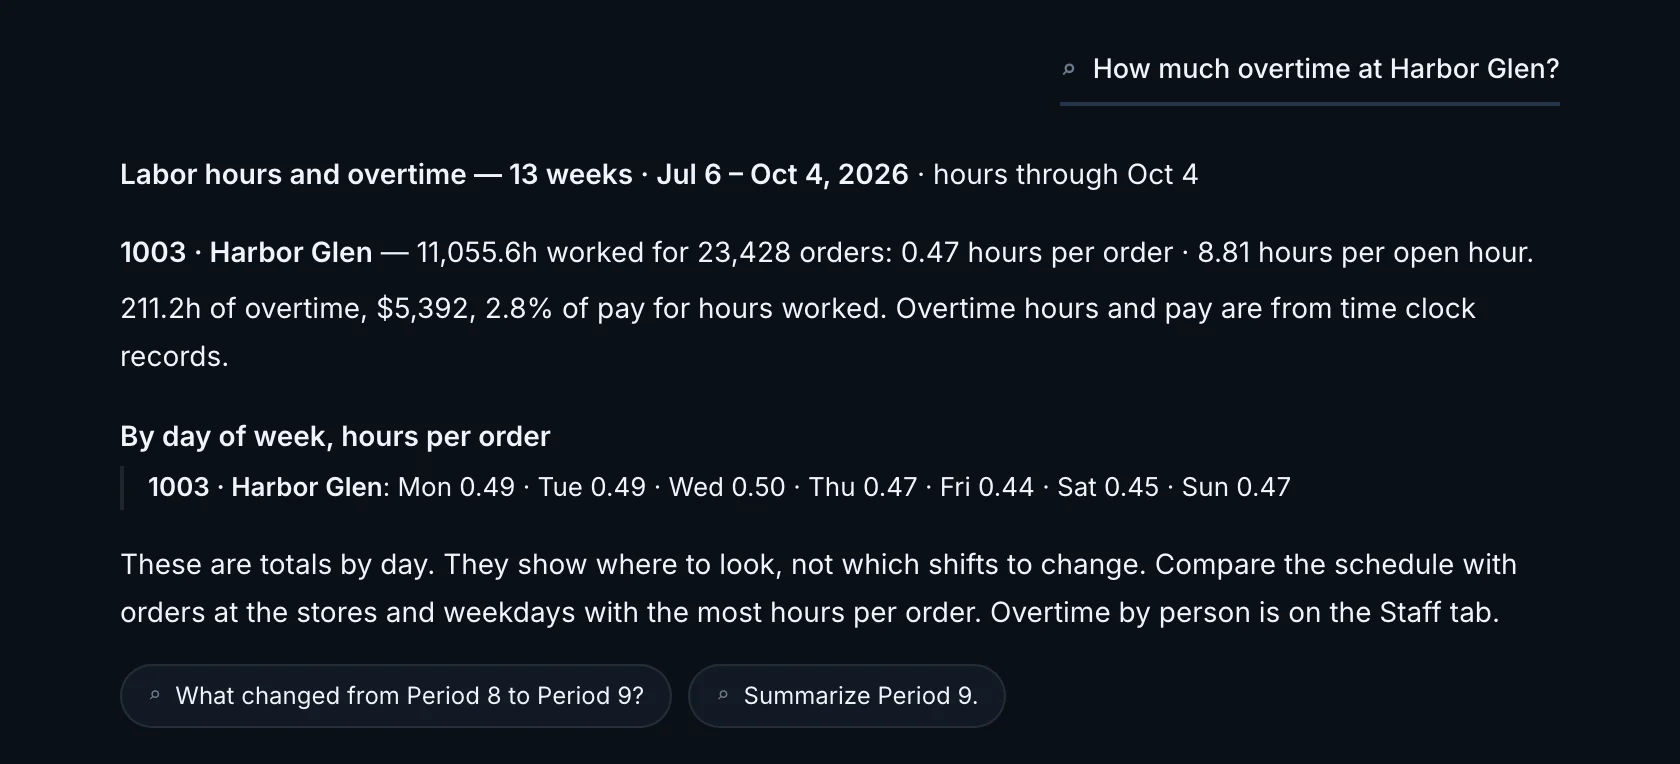
    Meal breaks, overtime and time-clock gaps, read from every punch.

    Staff
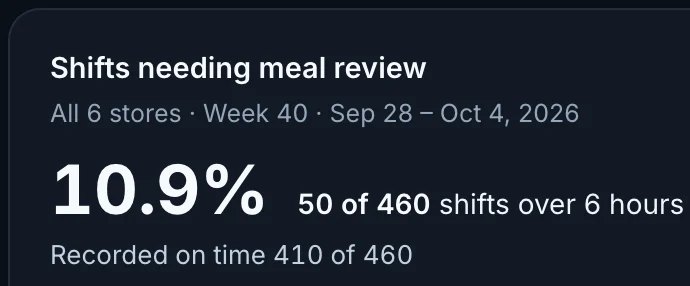
    A card titled Shifts needing meal review for all stores, week 40, Sep 28 to Oct 4, 2026. It reads 10.9%, then 50 of 460 shifts over 6 hours, with recorded on time 410 of 460 below. (opens the full-size screen)
    Week 40, all stores: 50 of 460 shifts over 6 hours need a meal review.Actual OpsIntel screen · synthetic demo data
  • Food and inventory

    Food used against recipe, yields, orders and transfers, store by store.

    Inventory
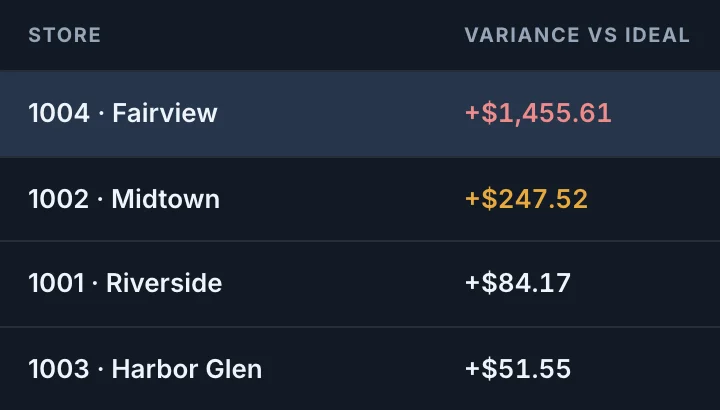
    A table with a Store column and a Variance vs ideal column. 1004 Fairview is the first row at +$1,455.61, followed by 1002 Midtown at +$247.52, 1001 Riverside at +$84.17 and 1003 Harbor Glen at +$51.55. (opens the full-size screen)
    Fairview is first, $1,455.61 over ideal.Actual OpsIntel screen · synthetic demo data
  • Marketplaces

    Statements beside the register, so a deduction that stands out is found.

    Marketplaces
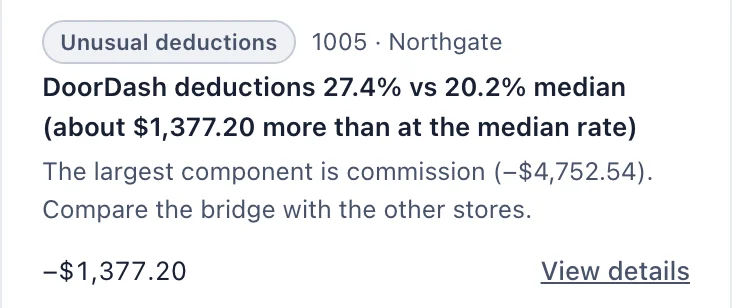
    One line of a list, tagged Unusual deductions, for 1005 Northgate. DoorDash deductions 27.4% vs 20.2% median, about $1,377.20 more than at the median rate. The largest component is commission, −$4,752.54. Compare the bridge with the other stores. (opens the full-size screen)
    Northgate’s deductions read 27.4% against a 20.2% median.Actual OpsIntel screen · synthetic demo data
  • Guest scores

    Overall satisfaction by store, ranked, with the number of surveys behind each score.

    Guest
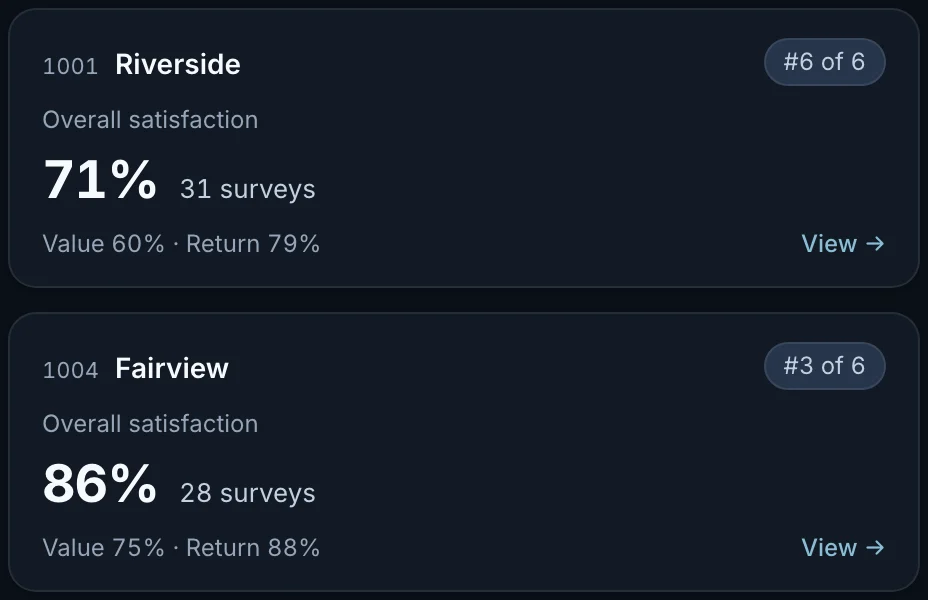
    Two store score cards. 1001 Riverside shows overall satisfaction 71% from 31 surveys, value 60%, return 79%, and the rank #6 of 6. Below it, 1004 Fairview shows 86% from 28 surveys and the rank #3 of 6. (opens the full-size screen)
    Riverside ranks last on overall satisfaction: 71%, from 31 surveys.Actual OpsIntel screen · synthetic demo data
  • Forecasts and trends

    Where this week will close, the next two weeks for each store, and where every measure is heading against the last few months.

    Forecast
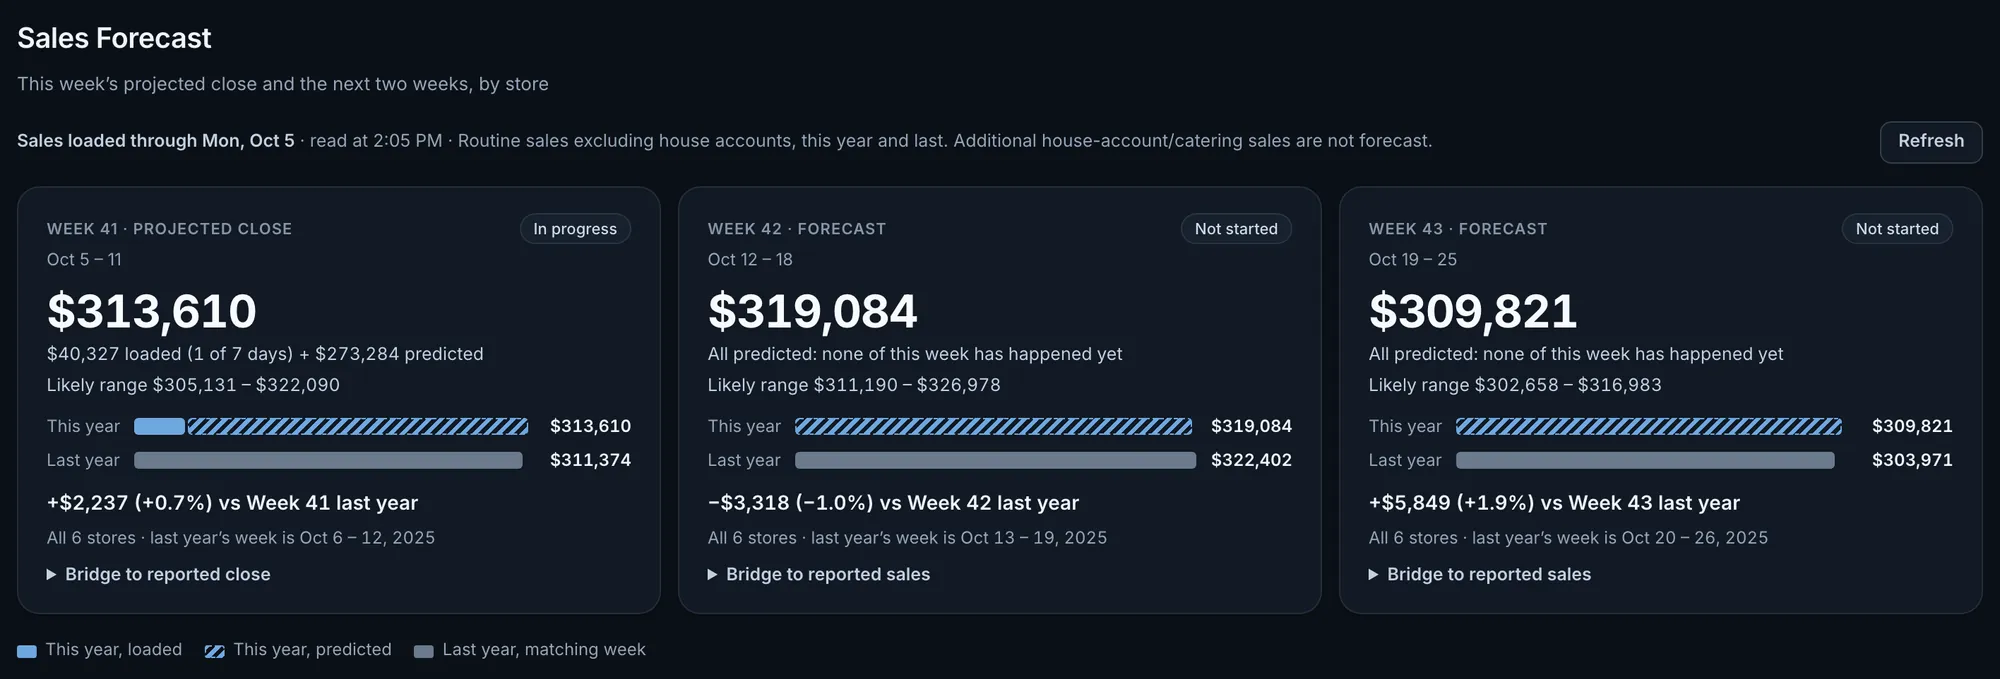
    Week 41 projected close of $313,610 for all stores, with $40,327 loaded after one of seven days, followed by forecasts for weeks 42 and 43. (opens the full-size screen)
    One day into the week: $40,327 loaded, $313,610 projected, likely range $305,131 to $322,090.Actual OpsIntel screen · synthetic demo data

When something goes wrong, our system sends you an alert with the store and the numbers behind it.

Product tour

See it store by store.

Seven parts of OpsIntel, each on the real screens.

Overview

Every store on one page, against last year and against its own target.
  • Sales by channel against last year, with both dates printed
  • Labor, food cost and FLM against each store’s target
  • A health score for the last closed period
Overview, step by step
Top of the Overview: an alerts row with 4 warnings across 3 stores, total net sales of $40,327 up 1.0% over last year, and an operational health score of 85.8. (opens the full-size screen)
Sales are up 1.0% over last year, with 4 warnings across 3 stores.Actual OpsIntel screen · synthetic demo data

Loss and Refunds

Voided, cancelled, zeroed and refunded orders, by store, totalled once.
  • Loss by store and over time
  • Payment refunds by channel and by day
  • Stores over the set amounts, with a link to their orders
Loss and Refunds, step by step
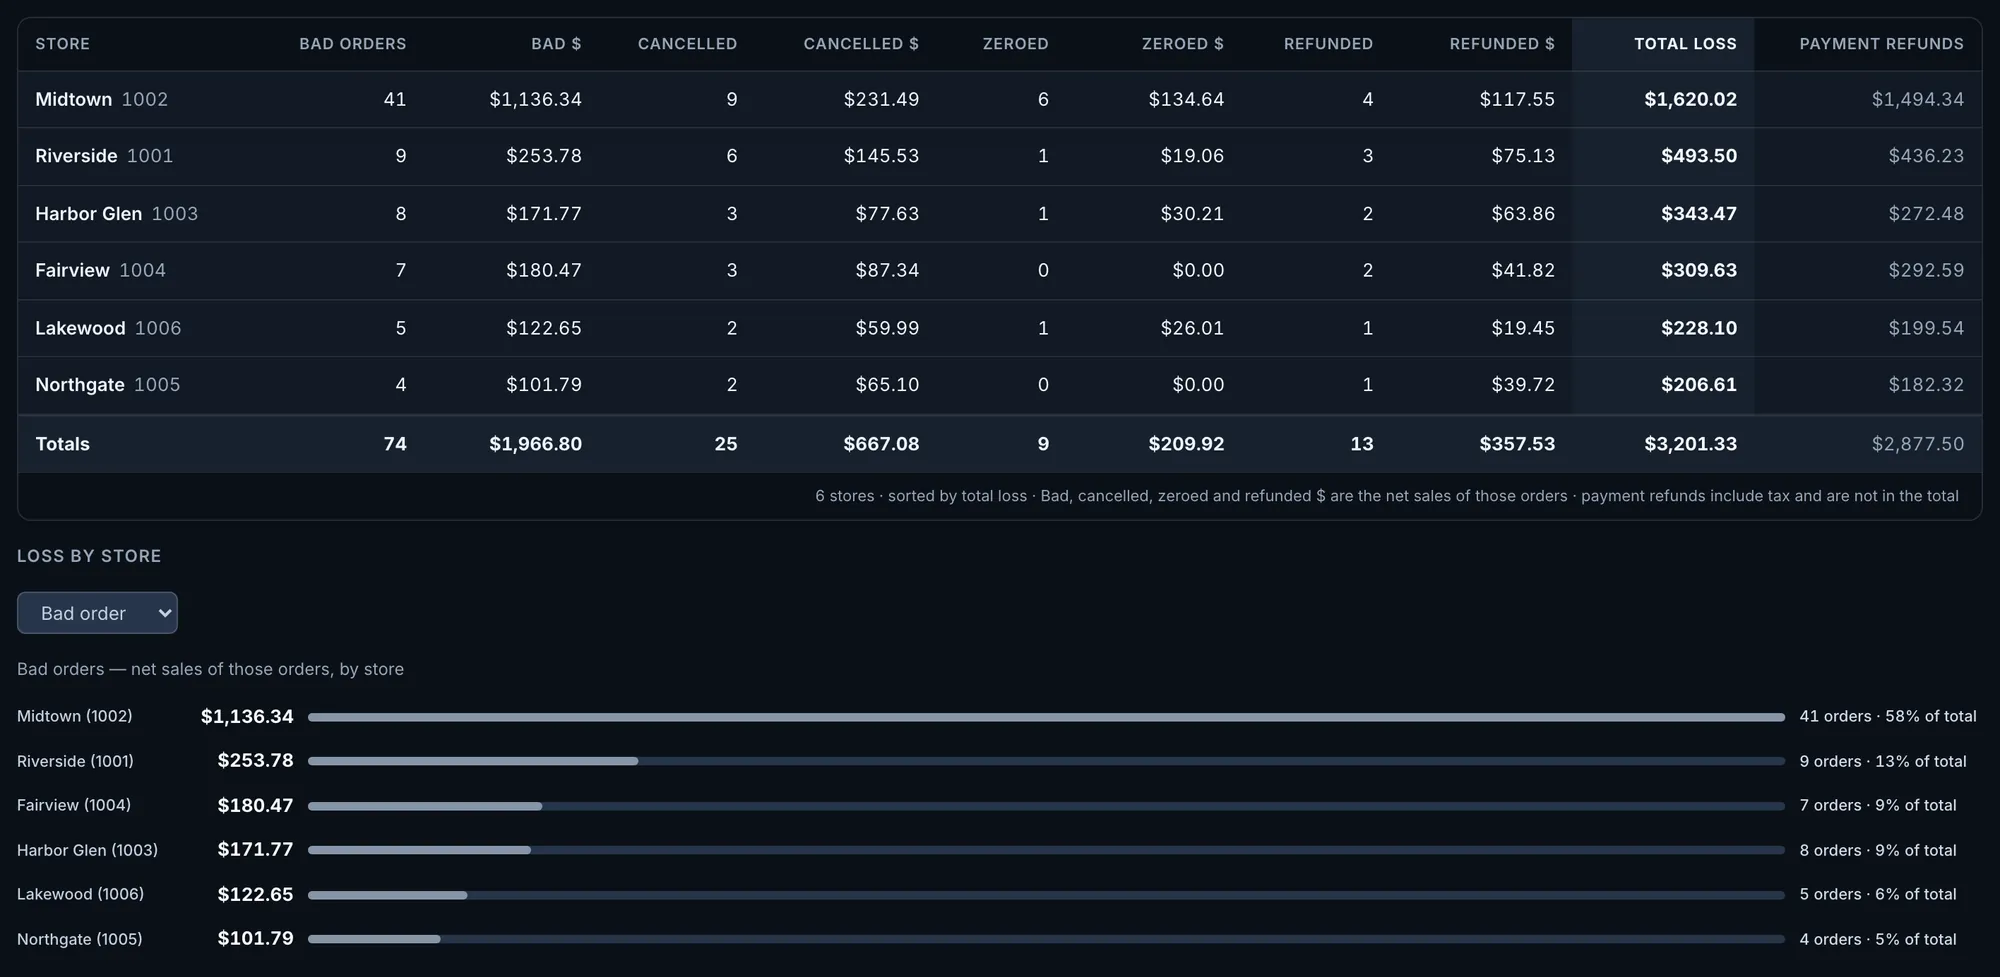
Loss by store. Midtown has 41 bad orders worth $1,136.34; the next store has nine. (opens the full-size screen)
Midtown had 41 voided orders, which the screen labels as bad orders. The next store had nine.Actual OpsIntel screen · synthetic demo data

Labor

Hours that fit the sales, by store and by day.
  • Scheduled against worked hours
  • Overtime building, and orders per worked hour
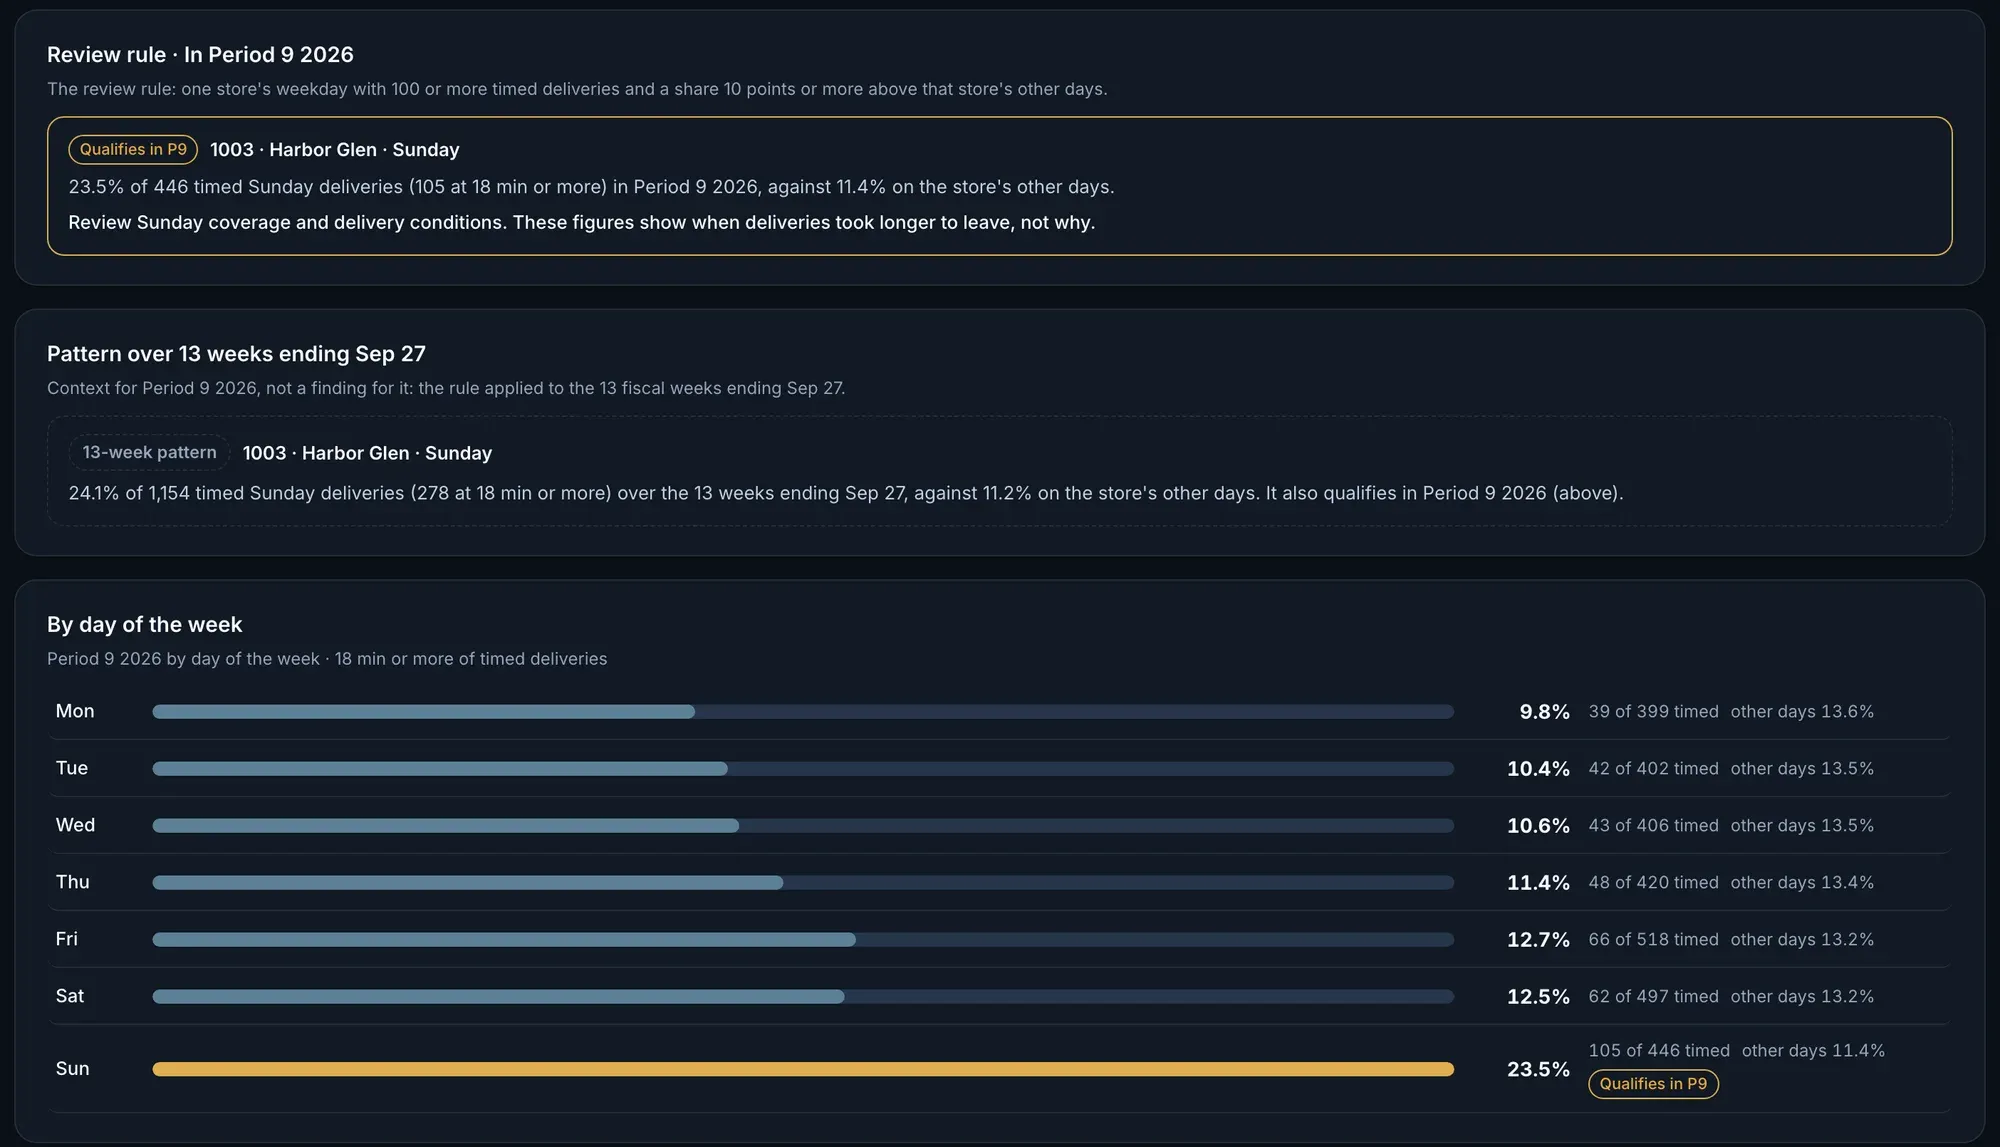
  • Late deliveries against the 18-minute standard
Labor, step by step
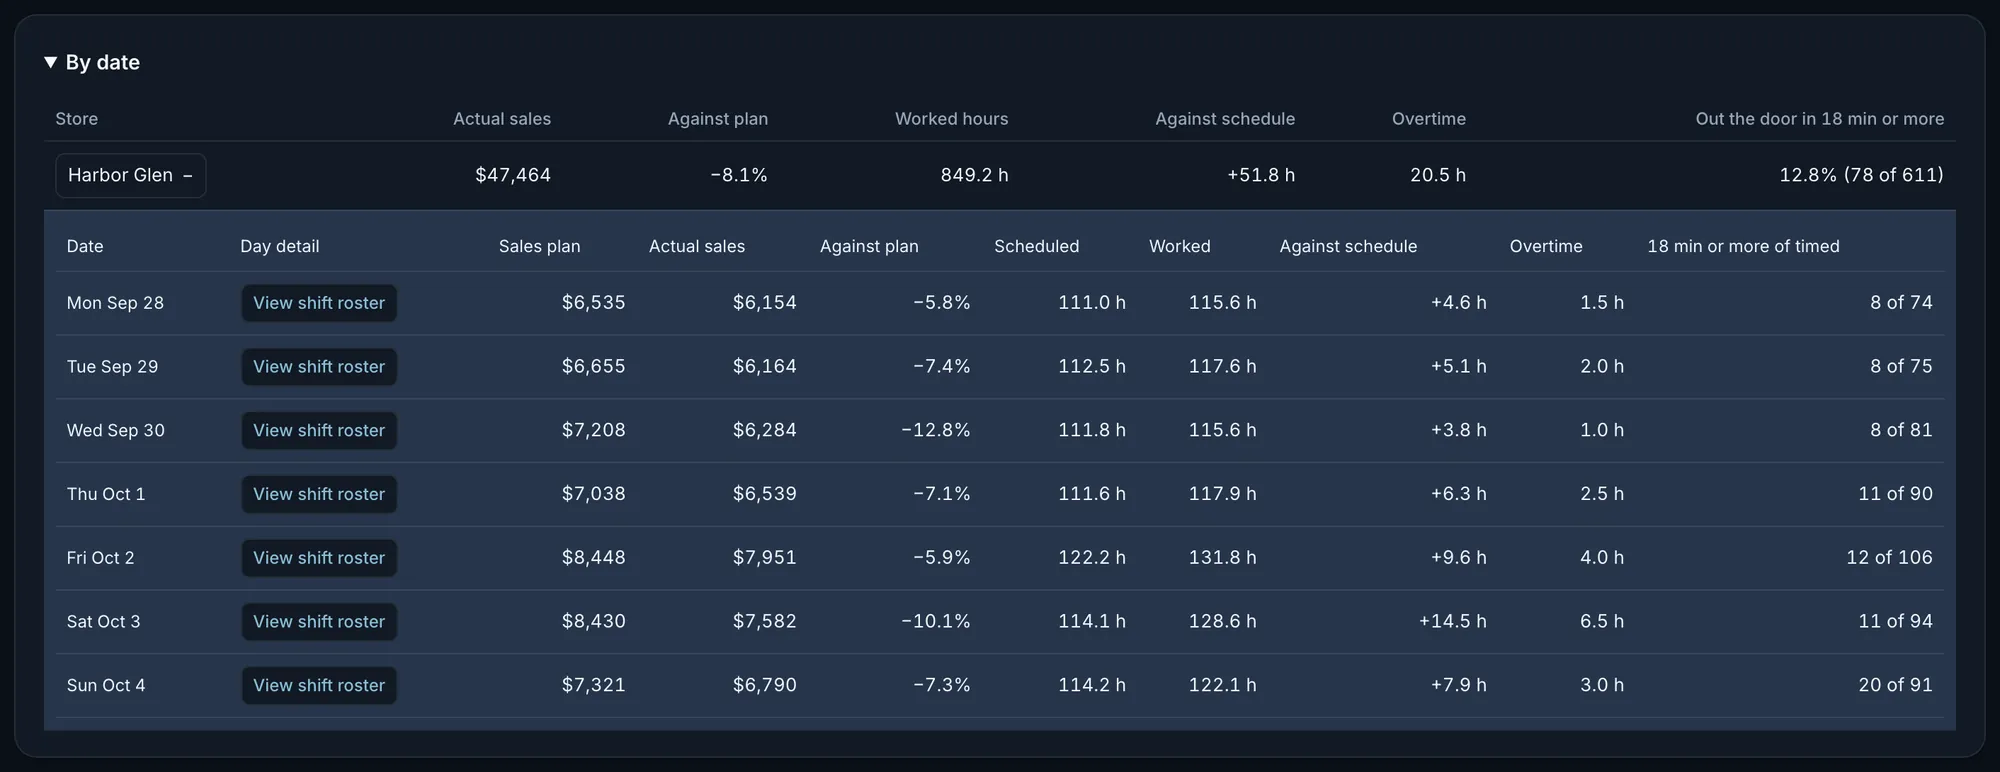
Harbor Glen, Monday to Sunday. Every day is under its sales plan and over its scheduled hours; Saturday is 14.5 hours over. (opens the full-size screen)
Every day came in under its sales plan and over its scheduled hours. Saturday was 14.5 hours over, with 6.5 hours of overtime.Actual OpsIntel screen · synthetic demo data

Inventory

Food used against recipe, store by store.
  • Stores ranked by usage above recipe
  • Yield against target, item by item
  • Invoices beside receipts, and both sides of a transfer
Inventory, step by step
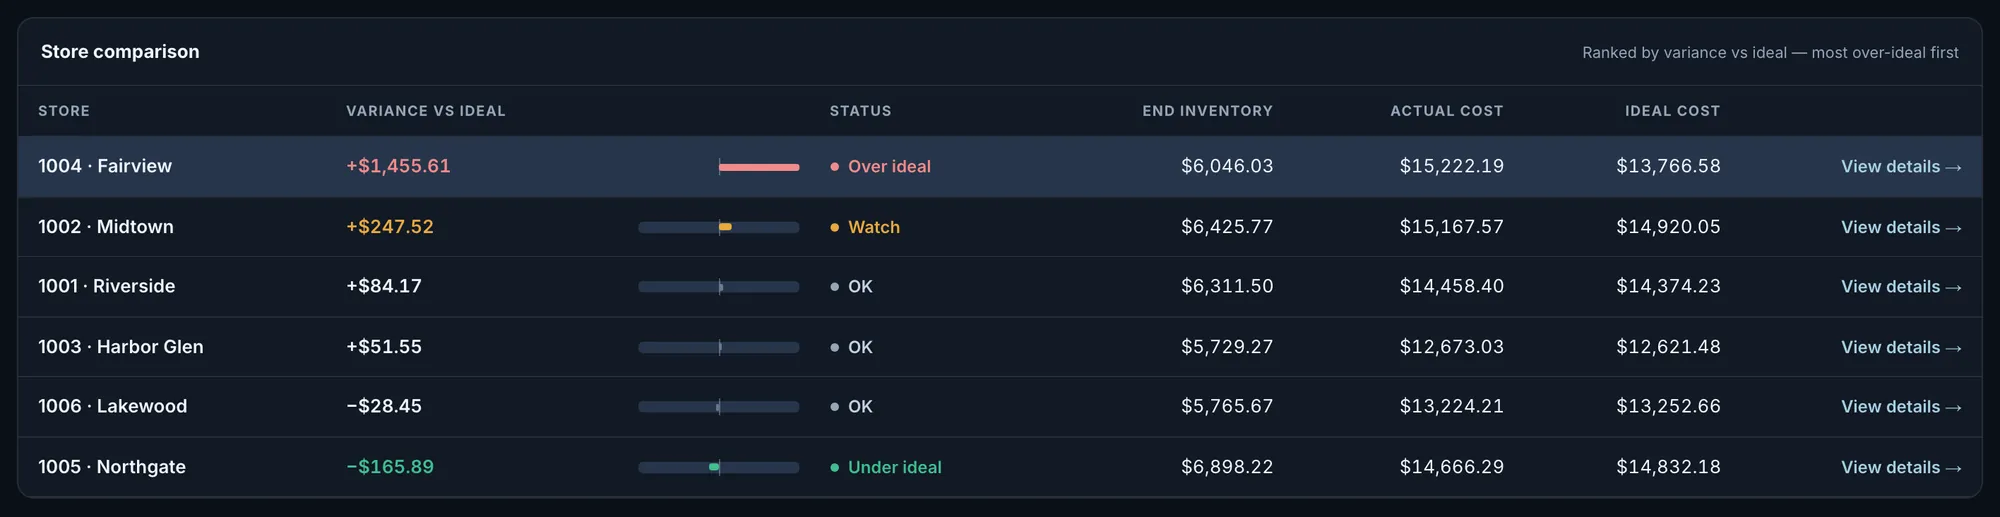
Store comparison. Fairview is $1,455.61 over ideal; Midtown is $247.52 over; Northgate is $165.89 under. (opens the full-size screen)
Fairview is $1,455.61 over ideal, most of the week’s total. The total is the sum of these rows.Actual OpsIntel screen · synthetic demo data

Marketplaces

Know whether the marketplaces paid you right.
  • Register sales beside DoorDash and Uber Eats statements
  • Deductions, error charges and payouts that did not arrive
  • Every difference on its own line, to the cent
Marketplaces, step by step
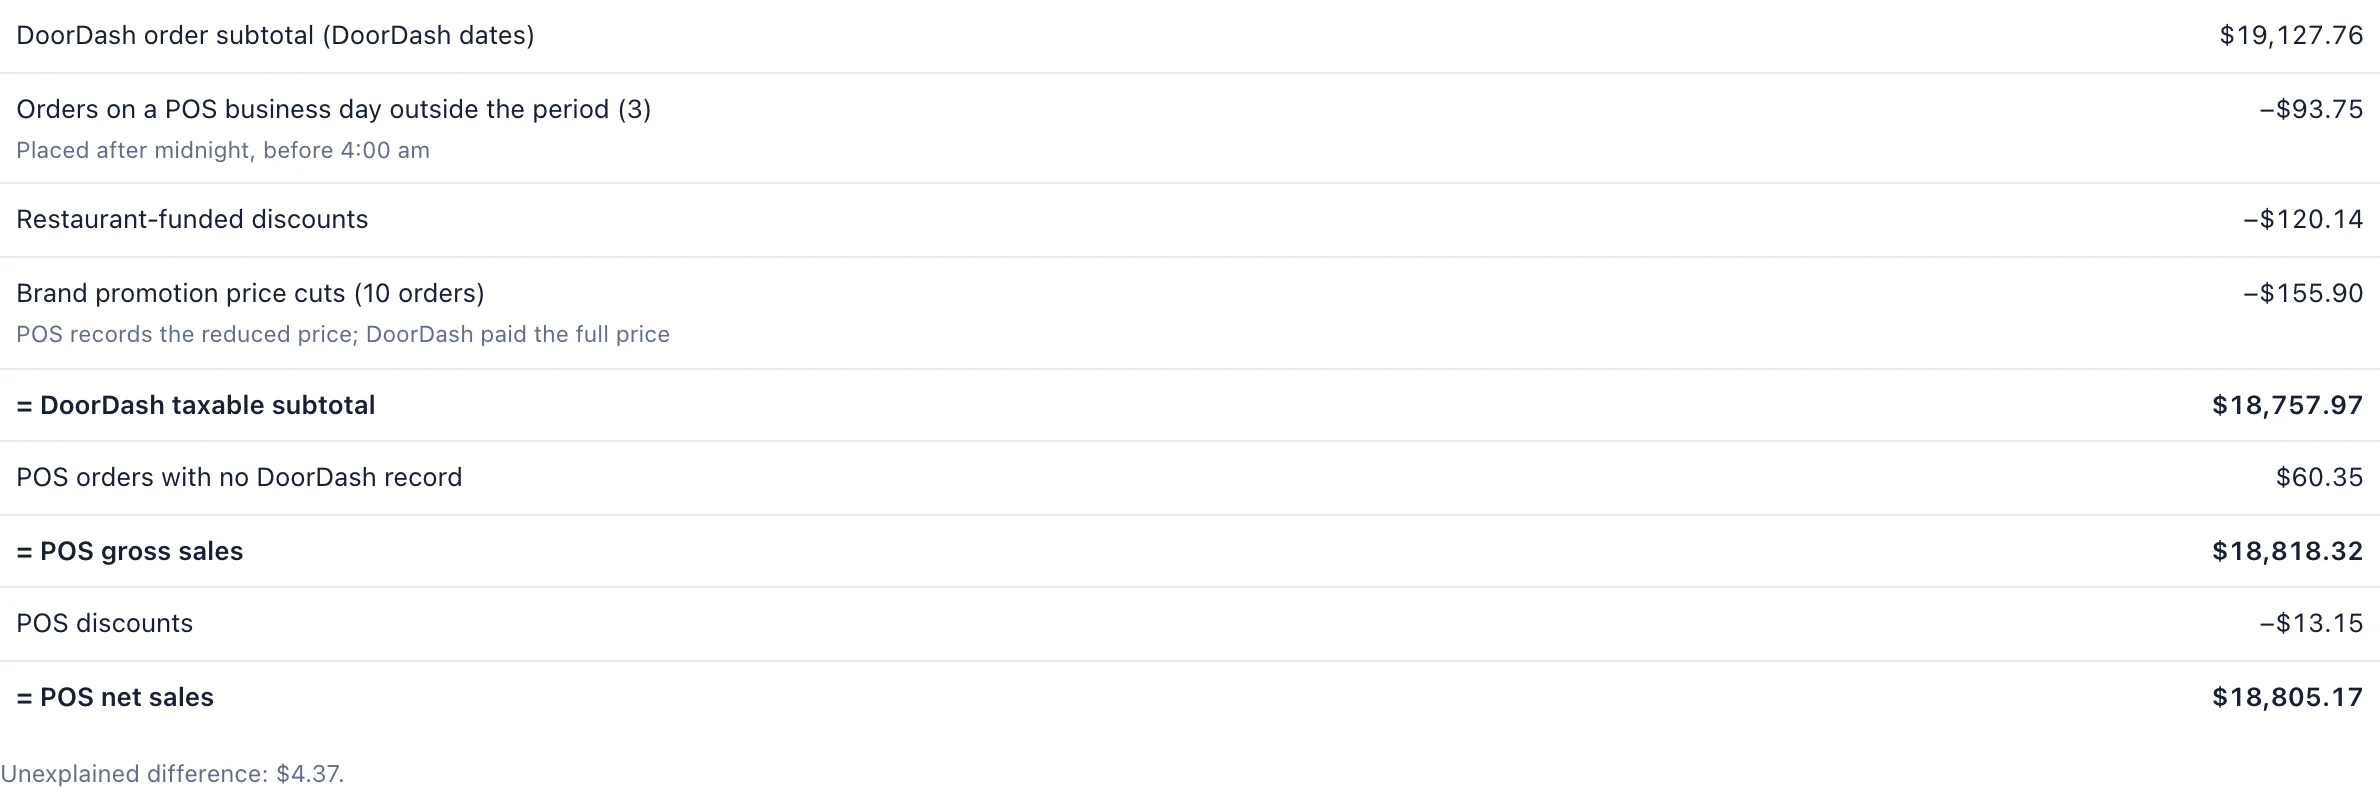
A list of lines for one store. DoorDash order subtotal on DoorDash dates $19,127.76. Orders on a POS business day outside the period, 3 of them, placed after midnight and before 4:00 am, −$93.75. Restaurant-funded discounts −$120.14. Brand promotion price cuts on 10 orders, where POS records the reduced price and DoorDash paid the full price, −$155.90. DoorDash taxable subtotal $18,757.97. POS orders with no DoorDash record $60.35. POS gross sales $18,818.32. POS discounts −$13.15. POS net sales $18,805.17. The last line reads Unexplained difference: $4.37. (opens the full-size screen)
One store: a DoorDash order subtotal of $19,127.76 and register net sales of $18,805.17. After the named lines, $4.37 is unexplained.Actual OpsIntel screen · synthetic demo data

P&L

Every store’s period side by side, from net sales to EBITDA.
  • Xero and QuickBooks integration
  • Labor, food and fees against target
  • A simulator for one store’s inputs
P&L, step by step
Store table for period 9. Harbor Glen: net sales $238,315, EBITDA 7.5%, labor 31.0% against a 25% target, $14,299 above target. (opens the full-size screen)
Harbor Glen finished at 7.5% EBITDA. Its P&L labor ran 31.0% against a 25% target, $14,299 above it.Actual OpsIntel screen · synthetic demo data

Alerts and reports

We stay on it.

Our system sends a short alert when something goes wrong, a weekly review and a report at the close of each period. Each opens in OpsIntel, and an alert stays open until someone marks it resolved.
Ask Intel

Every store. One question.

Ask across your connected store data. Follow up on what needs attention.

Recorded demoA real Intel answer · synthetic data for an invented company · Oct 2026

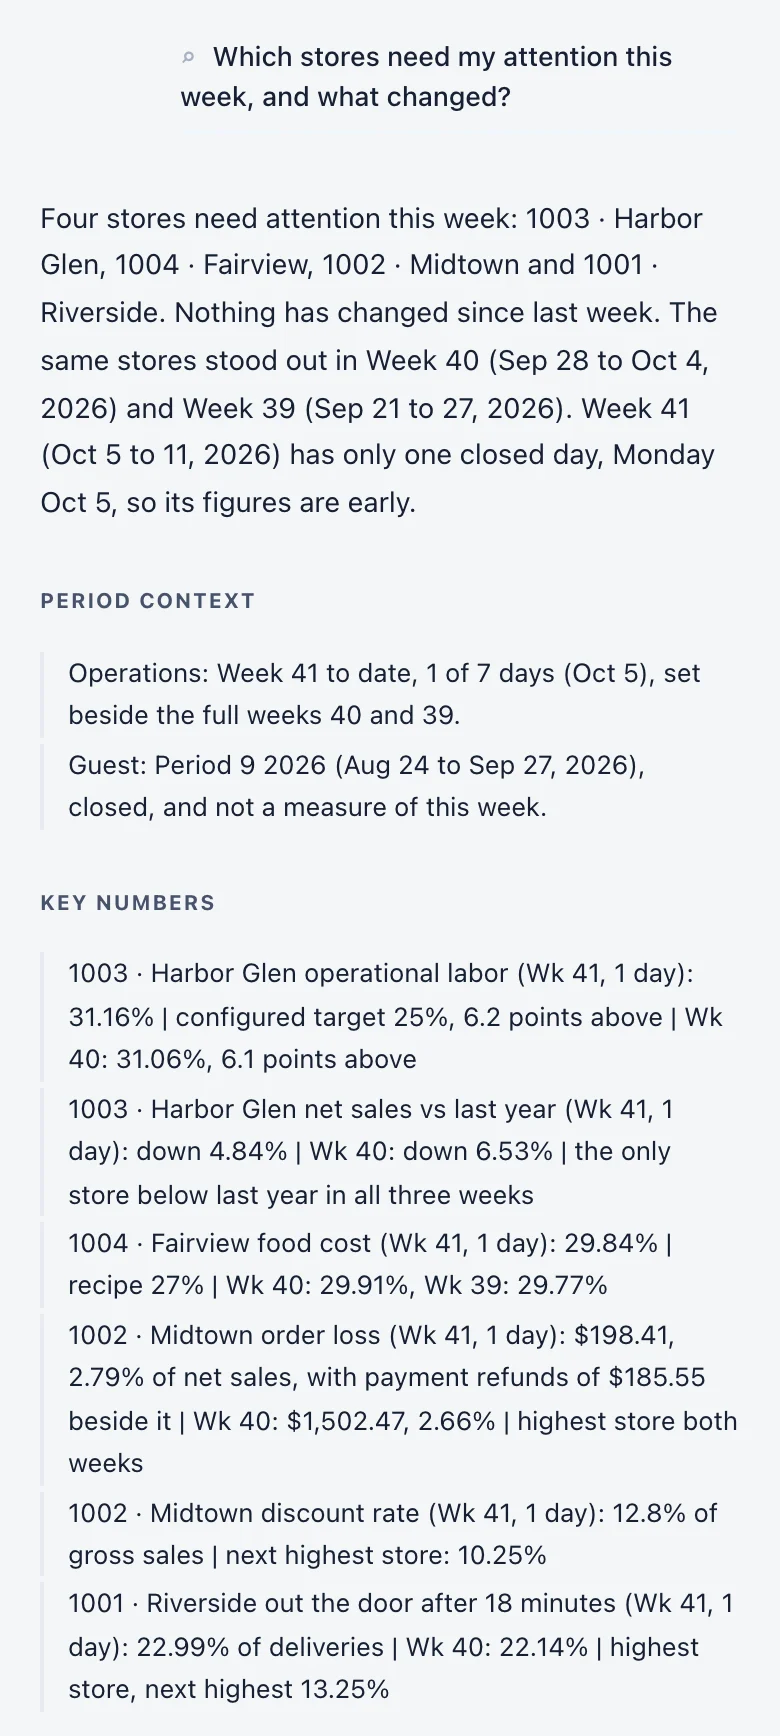
Question

Which stores need my attention this week, and what changed?

Excerpt from Intel’s answer, shortened

Four stores need attention this week Nothing has changed since last week.

Week 41 to date, 1 of 7 days (Oct 5), set beside the full weeks 40 and 39.

  • Harbor Glen operational labor (Wk 41, 1 day)

    31.16%

    • configured target 25%, 6.2 points above

    Wk 41, 1 day

    Wk 40: 31.06%

    target 25%

  • Fairview food cost (Wk 41, 1 day)

    29.84%

    • recipe 27%

    Wk 41, 1 day

    Wk 40: 29.91%

    Wk 39: 29.77%

    recipe 27%

  • Midtown order loss (Wk 41, 1 day)

    $198.41

    • 2.79% of net sales
    • Wk 40: $1,502.47, 2.66%

    order loss

    payment refunds of $185.55 beside it

  • Riverside out the door after 18 minutes (Wk 41, 1 day)

    22.99% of deliveries

    • Wk 40: 22.14%

    highest store

    next highest 13.25%

On this findingHarbor Glen

Follow-up question

What changed at Harbor Glen last week?

Excerpt from Intel’s answer, shortened

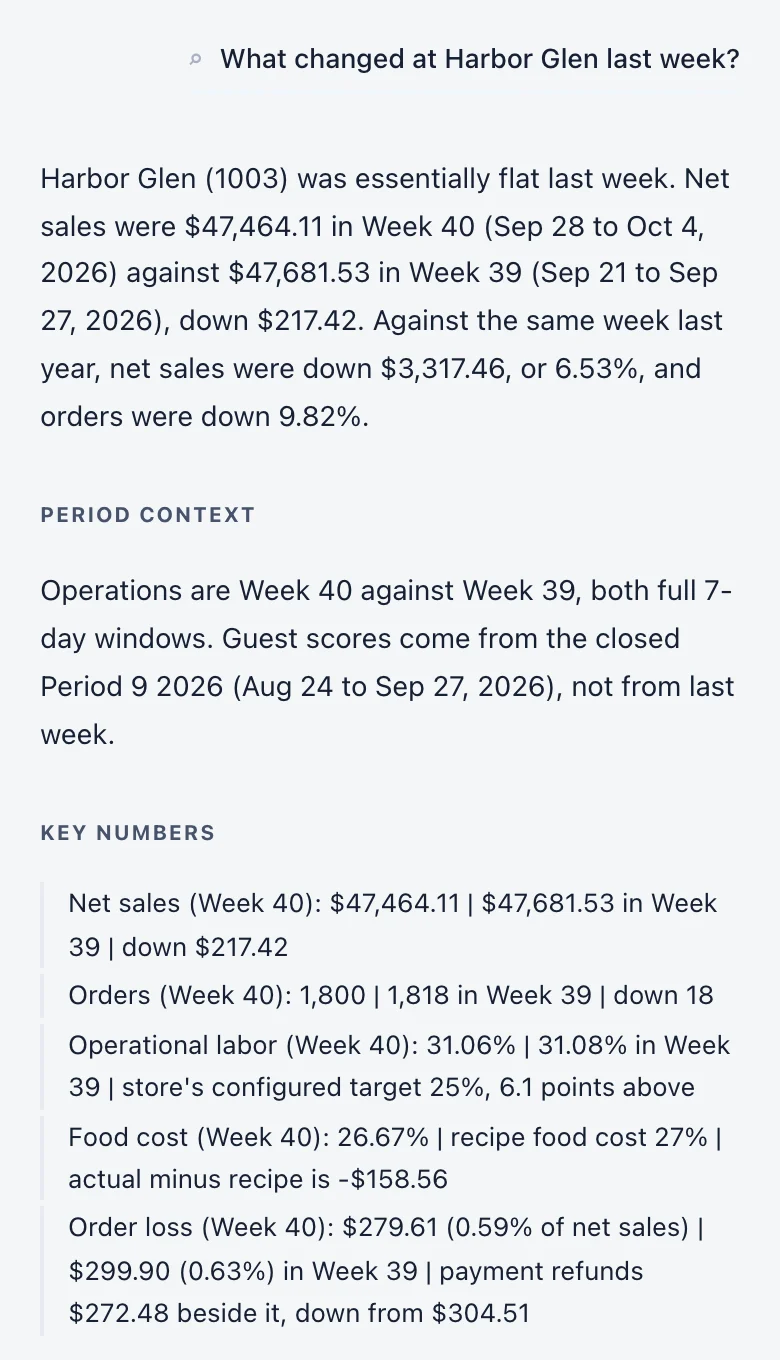
Harbor Glen was essentially flat last week.

Week 40 against Week 39, both full 7-day windows.

  • Net sales (Week 40)

    $47,464.11

    • $47,681.53 in Week 39
    • down $217.42

    Week 40

    Week 39

  • Operational labor (Week 40)

    31.06%

    • 31.08% in Week 39
    • store's configured target 25%, 6.1 points above

    Week 40

    Week 39

    target 25%

  • Orders (Week 40)

    1,800

    • 1,818 in Week 39
    • down 18

    Week 40

    Week 39

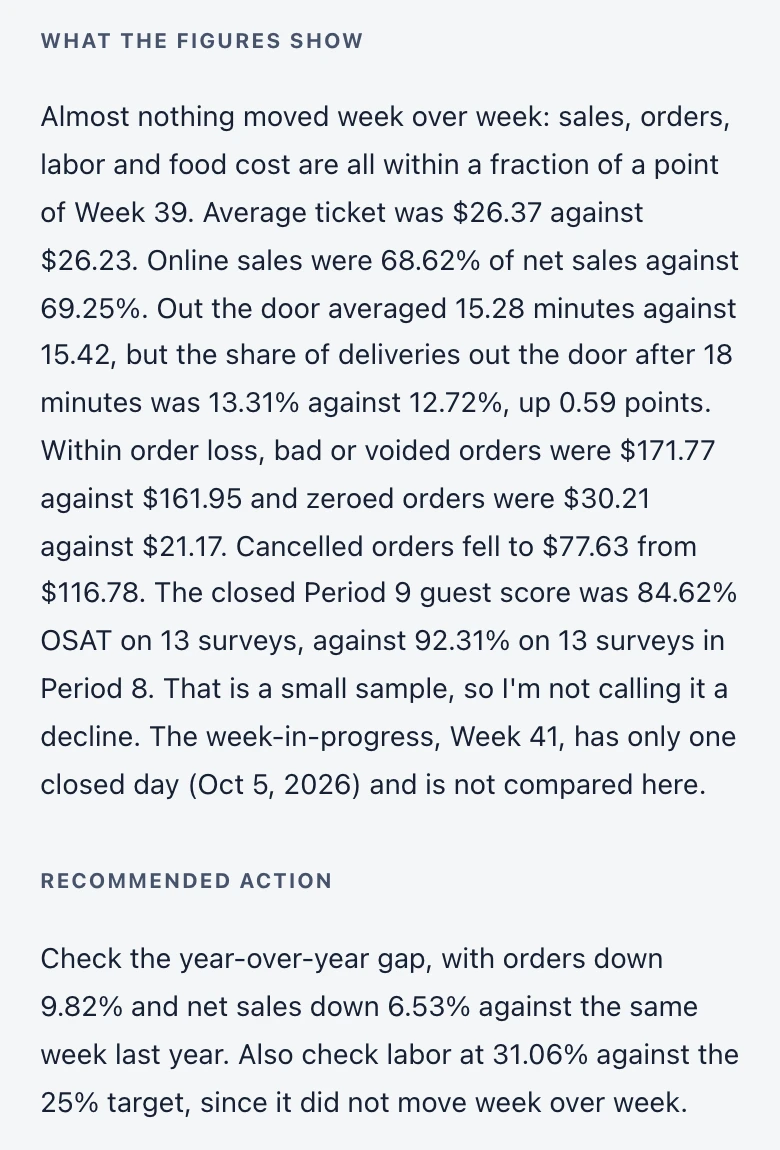
  • Against the same week last year, net sales were down $3,317.46, or 6.53%, and orders were down 9.82%.
  • 84.62% OSAT on 13 surveys, against 92.31% on 13 surveys in Period 8. That is a small sample, so I'm not calling it a decline.
Read the full answers

Each question was asked once, in one session, on the real Intel page. The company and its data are synthetic, and the figures in both answers were checked against that data.

The excerpts above are shortened and the bars are drawn from zero, to scale. These screens are the two answers whole, as Intel gave them.
The first answer
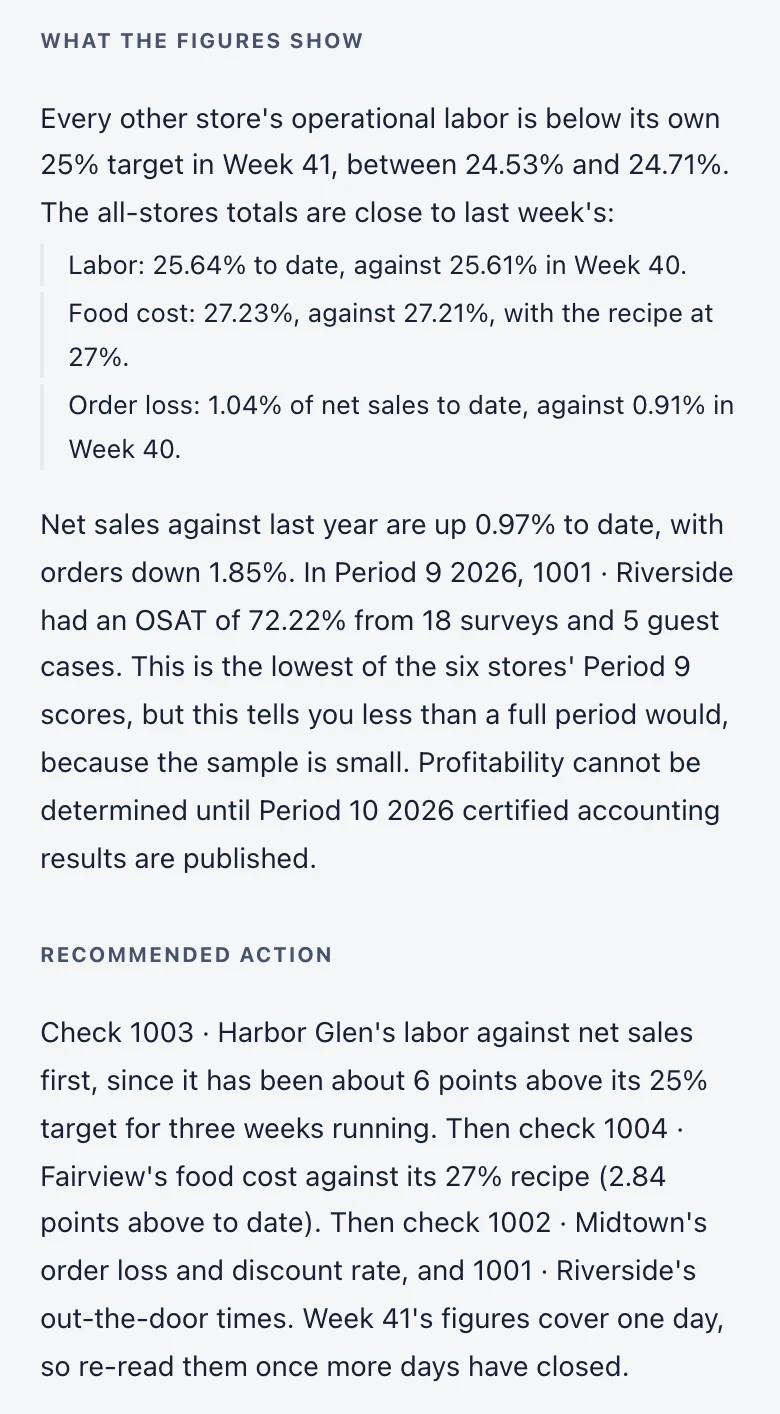
The Intel screen. The question typed: “Which stores need my attention this week, and what changed?” The answer: Four stores need attention this week: 1003 · Harbor Glen, 1004 · Fairview, 1002 · Midtown and 1001 · Riverside. Nothing has changed since last week. The same stores stood out in Week 40 (Sep 28 to Oct 4, 2026) and Week 39 (Sep 21 to 27, 2026). Week 41 (Oct 5 to 11, 2026) has only one closed day, Monday Oct 5, so its figures are early. Period Context: Operations: Week 41 to date, 1 of 7 days (Oct 5), set beside the full weeks 40 and 39. Guest: Period 9 2026 (Aug 24 to Sep 27, 2026), closed, and not a measure of this week. Key Numbers: 1003 · Harbor Glen operational labor (Wk 41, 1 day): 31.16% | configured target 25%, 6.2 points above | Wk 40: 31.06%, 6.1 points above; 1003 · Harbor Glen net sales vs last year (Wk 41, 1 day): down 4.84% | Wk 40: down 6.53% | the only store below last year in all three weeks; 1004 · Fairview food cost (Wk 41, 1 day): 29.84% | recipe 27% | Wk 40: 29.91%, Wk 39: 29.77%; 1002 · Midtown order loss (Wk 41, 1 day): $198.41, 2.79% of net sales, with payment refunds of $185.55 beside it | Wk 40: $1,502.47, 2.66% | highest store both weeks; 1002 · Midtown discount rate (Wk 41, 1 day): 12.8% of gross sales | next highest store: 10.25%; 1001 · Riverside out the door after 18 minutes (Wk 41, 1 day): 22.99% of deliveries | Wk 40: 22.14% | highest store, next highest 13.25%.The rest of the same answer. What The Figures Show: Every other store's operational labor is below its own 25% target in Week 41, between 24.53% and 24.71%. The all-stores totals are close to last week's: Labor: 25.64% to date, against 25.61% in Week 40. Food cost: 27.23%, against 27.21%, with the recipe at 27%. Order loss: 1.04% of net sales to date, against 0.91% in Week 40. Net sales against last year are up 0.97% to date, with orders down 1.85%. In Period 9 2026, 1001 · Riverside had an OSAT of 72.22% from 18 surveys and 5 guest cases. This is the lowest of the six stores' Period 9 scores, but this tells you less than a full period would, because the sample is small. Profitability cannot be determined until Period 10 2026 certified accounting results are published. Recommended Action: Check 1003 · Harbor Glen's labor against net sales first, since it has been about 6 points above its 25% target for three weeks running. Then check 1004 · Fairview's food cost against its 27% recipe (2.84 points above to date). Then check 1002 · Midtown's order loss and discount rate, and 1001 · Riverside's out-the-door times. Week 41's figures cover one day, so re-read them once more days have closed.
The follow-up answer
The Intel screen, the next question in the same conversation: “What changed at Harbor Glen last week?” The answer: Harbor Glen (1003) was essentially flat last week. Net sales were $47,464.11 in Week 40 (Sep 28 to Oct 4, 2026) against $47,681.53 in Week 39 (Sep 21 to Sep 27, 2026), down $217.42. Against the same week last year, net sales were down $3,317.46, or 6.53%, and orders were down 9.82%. Period Context: Operations are Week 40 against Week 39, both full 7-day windows. Guest scores come from the closed Period 9 2026 (Aug 24 to Sep 27, 2026), not from last week. Key Numbers: Net sales (Week 40): $47,464.11 | $47,681.53 in Week 39 | down $217.42; Orders (Week 40): 1,800 | 1,818 in Week 39 | down 18; Operational labor (Week 40): 31.06% | 31.08% in Week 39 | store's configured target 25%, 6.1 points above; Food cost (Week 40): 26.67% | recipe food cost 27% | actual minus recipe is -$158.56; Order loss (Week 40): $279.61 (0.59% of net sales) | $299.90 (0.63%) in Week 39 | payment refunds $272.48 beside it, down from $304.51.The rest of the same answer. What The Figures Show: Almost nothing moved week over week: sales, orders, labor and food cost are all within a fraction of a point of Week 39. Average ticket was $26.37 against $26.23. Online sales were 68.62% of net sales against 69.25%. Out the door averaged 15.28 minutes against 15.42, but the share of deliveries out the door after 18 minutes was 13.31% against 12.72%, up 0.59 points. Within order loss, bad or voided orders were $171.77 against $161.95 and zeroed orders were $30.21 against $21.17. Cancelled orders fell to $77.63 from $116.78. The closed Period 9 guest score was 84.62% OSAT on 13 surveys, against 92.31% on 13 surveys in Period 8. That is a small sample, so I'm not calling it a decline. The week-in-progress, Week 41, has only one closed day (Oct 5, 2026) and is not compared here. Recommended Action: Check the year-over-year gap, with orders down 9.82% and net sales down 6.53% against the same week last year. Also check labor at 31.06% against the 25% target, since it did not move week over week.

Intel answers from the store data you have connected.

What you can ask

Intel is included in the paid Premium plan. It is not part of the free trial.

How operators use it

One finding, followed step by step: from the screen it shows up on to what to review next.

The investigation in three lines
Finding
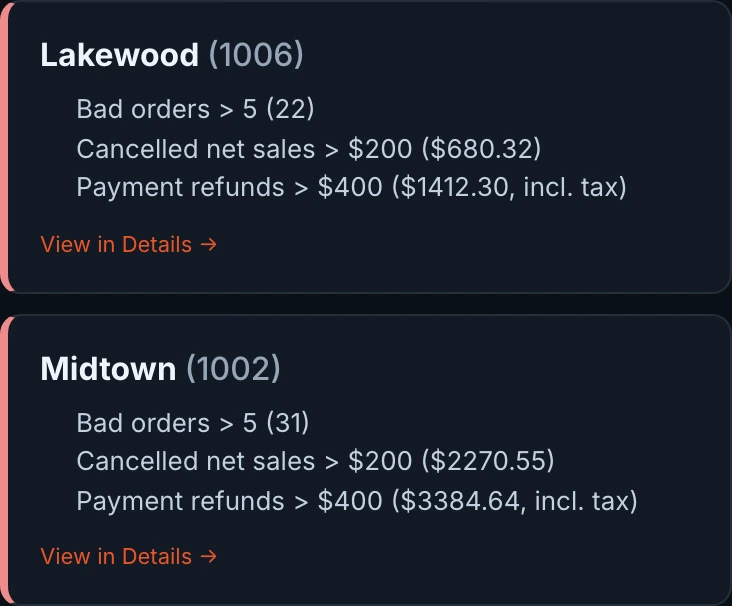
Midtown’s payment refunds for Period 8 are $3,384.64, more than twice the next store.
Evidence
Two days, Aug 8 and Aug 11, carry $2,176.17 of it. The other 26 days together come to $1,208.47.
What to review next
Trace the orders behind those two days in the store’s order records, then check what changed next week.

A finding is only the beginning.

$3,384.64 in payment refundsMidtown · Period 8 · Jul 27 to Aug 23, 2026

  • Sat, Aug 8$1,764.17
  • Tue, Aug 11$412.00
  • Other 26 days, total$1,208.47
Modelled on an investigation at one of our own stores · store, dates and every figure changed · the real product on invented dataModelled on our own stores · store, dates and figures changed
  1. Two of the stores listed for fiscal period 8 with the amounts they are over. Lakewood: bad orders over 5 (22), cancelled net sales over $200 ($680.32), payment refunds over $400 ($1412.30, including tax). Midtown: bad orders over 5 (31), cancelled net sales over $200 ($2270.55), payment refunds over $400 ($3384.64, including tax).

    01 Something needs attentionOpsIntel shows

    Midtown’s payment refunds for the period are $3,384.64, more than twice the next store.

    Loss and Refunds · Period 8 · Jul 27 to Aug 23, 2026
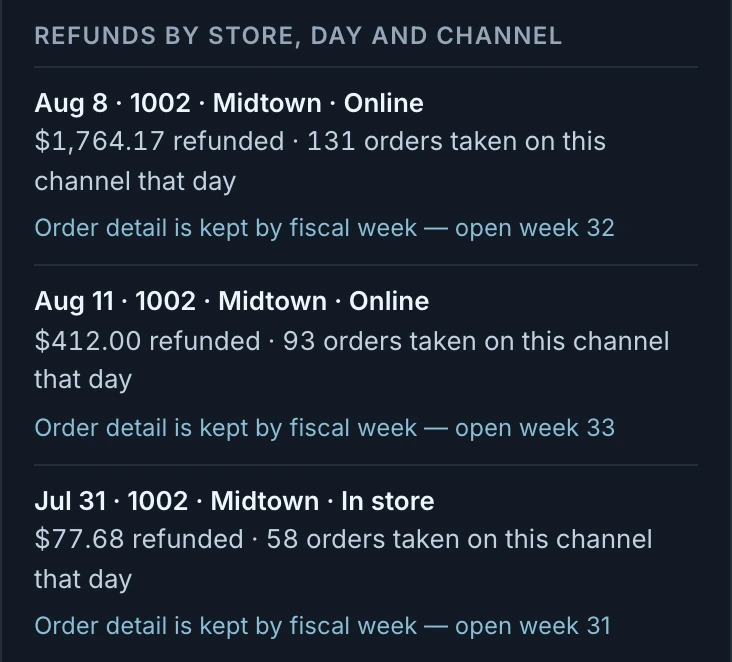
  2. Midtown’s payment refunds by day and channel, largest first. Aug 8, online: $1,764.17 refunded, 131 orders taken on this channel that day. Aug 11, online: $412.00 refunded, 93 orders taken. Jul 31, in store: $77.68 refunded, 58 orders taken. Each line notes that order detail is kept by fiscal week.

    02 Follow the moneyOpsIntel shows

    Two days carry $2,176.17 of it.

    Midtown · payment refunds by day · Period 8
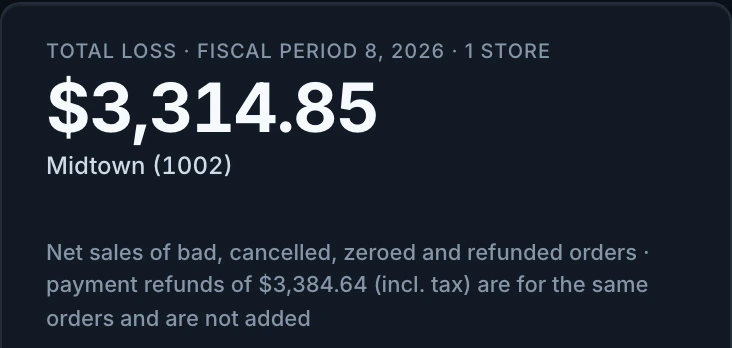
  3. Midtown’s total loss for fiscal period 8: $3,314.85, the net sales of bad, cancelled, zeroed and refunded orders. Under it the screen says payment refunds of $3,384.64, including tax, are for the same orders and are not added.

    03 Understand what it isOpsIntel shows · Loss and Refunds screen

    Refunds are not a second loss. They are money returned for orders already in the $3,314.85, so they are counted once.

    Midtown · total loss · Period 8

  4. What to review next

    1. Trace the orders behind the refunds on Aug 8 and Aug 11 in the store’s order records.
    2. Check whether Aug 11’s $412.00 carries tax, and whether any of it repeats an order from Aug 8.

    To ask the store: was an order from Aug 8 entered again on Aug 11?

    04 What to review nextProposed next step

    A proposed next step. OpsIntel shows the totals by store and by day, so you know exactly where to look.

    To trace in the store’s order records · Aug 8 and Aug 11, 2026

  5. Check what changed next week.

    05 Check the resultNext

    Nothing has been recovered and no result is claimed. The same screen shows next week’s refunds by day.

    Against Midtown’s ordinary rate: $1,208.47 over the other 26 days combined, about $46 a day

    Loss and Refunds, step by step

Loss and Refunds, step by step

Security and access

Your numbers stay yours.

  • Each organization kept apart

    Every request is tied to the member’s own organization on the server before any figure is returned.

  • Only the people you invite

    Each invitation is tied to one email address and can be revoked. Two roles, Owner and Admin, decide who holds billing and settings.

  • Read-only connections

    Our system reads your books from Xero or QuickBooks. It cannot post, edit or pay anything.

Security and access

Built by operators, for operators.

We built it for our own stores first.

We run a restaurant franchise. Every store produces a POS report, a time-clock export, inventory counts, guest surveys and a set of books, and nobody puts them side by side. So we built the thing that reads it, and our own stores were the test.

The OpsIntel team

Questions

What operators ask us first.

What systems does it bring together?

Sales and orders, time clocks and schedules, inventory counts, orders and transfers, guest surveys, your DoorDash and Uber Eats statements, and your accounting software, Xero and QuickBooks. OpsIntel puts all of them in one place, so you do not open each system for each store.

Do I have to go looking for problems?

No. Our system checks every store every day and sends you an alert when something goes wrong: money leaking, a fraud pattern that repeats on the same shift, time-clock manipulation, discount abuse, or waste running over. Each alert comes with the store and the numbers behind it.

Do my managers have to do anything new?

No. It reads what your stores already report. No new counts and no new app at the store.

Is this AI?

Parts of it. The numbers are calculated by ordinary code from your data. AI is used in two places: to answer questions you type, which is part of the Premium plan, and to write the summary when you press Explain these results on your marketplace statements.

Who can see my data?

The people you invite to your organization. There are two roles today, Owner and Admin, and both see all of your stores. Named OpsIntel staff can reach it to support you. The Security page lists what is in place and what is not.

Who is it for?

Operators running several restaurant locations who do not have the time to open every system and analyse every report for every store. We do the analysis, and you run the business.

We do the analysis.

You run the business. The demo is thirty minutes on the live product.